IRAS Explanatory Supplement
VI. Flux Reconstruction and Calibration
C. Absolute Calibration
C.3 Color Corrections
Chapter Contents | Introduction | Authors | References
If the input energy distribution is not constant in flux per octave a correction, the "color correction", must be applied to the quoted flux densities. This correction depends on the shape of the intrinsic energy distribution and on the details of the wavelength response of the system. The color corrections for a number of input energy distributions are given in Table VI.C.6.
The flux F measured by a detector is given by:
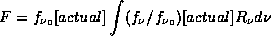
(VI.C.4)
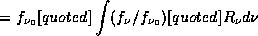
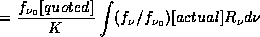
In these equations,
![]() 0
is the effective frequency of 25, 12. 5, and 3 × 10¹² Hz
corresponding to the effective wavelengths of 12, 25, 60 and 100 µm,
fv is either the actual or quoted flux
density of the source,
(fv/fv0)
is the flux density normalized to the effective frequency of the band
R
0
is the effective frequency of 25, 12. 5, and 3 × 10¹² Hz
corresponding to the effective wavelengths of 12, 25, 60 and 100 µm,
fv is either the actual or quoted flux
density of the source,
(fv/fv0)
is the flux density normalized to the effective frequency of the band
R![]() is the relative system response listed in the last column of
Table II.C.5. Equations
VI.C.4 and VI.C.6 show that the true
flux density at
is the relative system response listed in the last column of
Table II.C.5. Equations
VI.C.4 and VI.C.6 show that the true
flux density at
![]() 0 is
given by:
0 is
given by:

where, from Eq. VI.C.4 and VI.C.5,

It should be emphasized that there is no prejudice in the procedure or assumptions. The uncertainty in the quoted flux densities results directly from the lack of knowledge of the spectral response of the system. Deriving the true flux densities requires a knowledge of the intrinsic energy distribution of the astronomical sources.
The sensitivity of the color connections to uncertainties in the spectral band passes was checked by numerical simulations. For many sources of interest in the catalog the 60 µm band flux densities are especially sensitive to errors caused by lack of knowledge of the spectral pass band. Specifically, in this band uncertainties in the short wavelength parameters of the transmission of the optics, and in the detector efficiency, affect the response for extremely cold objects (T ~ 60 K) in a significantly different way than for the stellar energy distribution of the calibrating sources. The numerical tests show that the sensitivity of the color connections to wavelength shifts of the entire response is approximately 7%/µm; prelaunch measurements of the spectral shape should be accurate to ~0.3 µm. On the other hand, if the effective responsivity of the system increases by an additive 1% over the entire bandwidth, starting at 25 µm, the calibration for 60 K sources changes by 16% relative to the stellar calibration. Uncertainties of this magnitude in the effective response are the maximum expected from pre-flight measurements. Errors in the long wave cutoff of the 100 µm band could also result in significant errors in the flux densities of objects colder than 30 K.
Chapter Contents | Introduction | Authors | References
Table of Contents | Index | Previous Section | Next Section