|
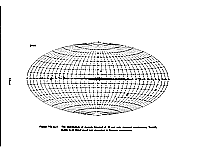
Figure VII.Ap.1 The distribution of sources detected at 12 µm
only (spectral combination "1000") shown in an Aitoff
equal area projection in Galactic coordinates.
larger
largest
|
|

|
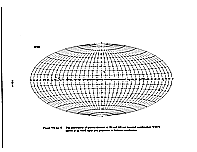
Figure VII.Ap.2 The distribution of sources detected at 12 and
25 µm (spectral combination "1100") shown in
an Aitoff equal area projection in Galactic coordinates.
larger
largest
|
|

|
Figure VII.Ap.3 The distribution of sources detectfed at 12,
25 and 60 µm (spectral combination "1 1 1 0")
shown
in Aitoff equal area projection in Galactic coordinates.
larger
largest
|
|

|
Figure VII.Ap.4 The distribution of sources detected at 12,
25, 60 and 100 µm (spectral combination
"1 1 1 1") shown
in an Aitoff equal area projection in Galactic coordinates.
larger
largest
|
|

|
Figure VII.Ap.5 The distribution of sources detected at 25
only (spectral combination "0 1 0 0") shown in an Aitoff
equal area projection in Galactic coordinates.
larger
largest
|
|

|
Figure VII.Ap.6 The distribution of sources detected at 25
and 60 µm (spectral combination "0 1 1 0")
shown in
an Aitoff equal area projection in Galactic coordinates.
larger
largest
|
|

|
Figure VII.Ap.7 The distribution of sources detected at 25,
60 and 100 µm (spectral combination "0 1 1 1")
shown
in an Aitoff equal area projection in Galactic coodinates.
larger
largest
|
|

|
Figure VII.Ap.8 The distribution of sources detected at 60
um only (spectral combination "0 0 1 0") shown in an
Aitoff equal area projection in Galactic coordinates.
larger
largest
|
|

|
Figure VII.Ap.9 The distribution of sources detected at 60
and 100 µm (spectral combination "0 0 1 1")
shown in
an Aitoff equal area projection in Galactic coordinates.
larger
largest
|
|

|
Figure VII.Ap.10 The distribution of sources detected at 100
µm only (spectral combination "0 0 0 1") shown in an
Aitoff equal area projection in Galactic coordinates.
larger
largest
|
|

|
Figure VII.Ap.11 The distribution of sources detected at 12
and 60 µm (spectral combination "1 0 1 0"
shown in an
Aitoff equal area projection in Galactic coordinates.
larger
largest
|
|

|
Figure VII.Ap.12 The distribution of sources detected at 12
and 100 µm (spectral combination "1 0 0 1")
shown in
an Aitoff equal area projection in Galactic coordinates.
larger
largest
|
|

|
Figure VII.Ap.13 The distribution of sources detected at 12,
25 and 100 µm (spectral combination "1 1 0 1")
shown
in an Aitoff equal area projection in Galactic coordinates.
larger
largest
|
|

|
Figure VII.Ap.14 The distribution of sources detected at 12,
60 and 100 µm (spectral combination "1 0 1 1")
shown
in an Aitoff equal area projection in Galactic coordinates.
larger
largest
|
|

|
Figure VII.Ap.15 The distribution of sources detected at 25
and 100 µm (spectral combination "0 1 0 1")
shown in
an Aitoff equal area projection in Galactic coordinates.
larger
largest
|
|

|
Figure VII.Ap.16 The distribution on the sky of sources with
a probability of variability greater than 0.9 is shown in an Aitoff
equal area projection in Galactic coordinates.
larger
largest
|
|

|
Figure VII.Ap.17 The distribution of 12 µm point sources that
had only a single hours-confirmed sighting (an HCON) is shown
in an equal area Aitoff projection in Galactic coordinates.
larger
largest
|
|

|
Figure VII.Ap.18 The distribution of 25 µm point sources that
had only a single hours-confirmed sighting (an HCON) is shown
in an equal area Aitoff projection in Galactic coordinates.
larger
largest
|
|

|
Figure VII.Ap.19 The distribution of 60 µm point sources that
had only a single hours-confirmed sighting (an HCON) is shown
an equal area Aitoff projection in Galactic coordinates.
larger
largest
|
|

|
Figure VII.Ap.20 The distribution of 100 µm point sources that
had only a single hours-confirmed sighting (an HCON) is shown
in an equal area Aitoff projection in Galactic coordinates.
larger
largest
|
|

|
Figure VII.Ap2.21 The distribution of point sources that were
tagged as having four or more nearby, hours-confirmed smalll extended
sources detected at 100 µm
(SES1  4), and therefore likely
to be corrupted by the infrared cirrus, is shown in an equal area
Aitoff projection in Galactic coordinates. 4), and therefore likely
to be corrupted by the infrared cirrus, is shown in an equal area
Aitoff projection in Galactic coordinates.
larger
largest
|
|

|
Figure VII.Ap.22 The distribution of sources that were tagged
as having one or more nearby, weeks-confirmed small extended sources
(SES1 > 0) is shown in an equal area Aitoff projection in Galactic
coordinates.
larger
largest
|
|

|
Figure VII.Ap.23 The distribution of sources that were tagged
as having between four and eight nearby, hours-confirmed point
sources detected only at 100 µm, (8>CIRR1>4),
and therefore
likely to be contaminated by the infrared cirrus, is shown in
an equal area Aitoff projection in Galactic coordinates.
larger
largest
|
|

|
Figure VII.Ap.24 The distribution of sources that were tagged
as having the cirrus flag CIRR2 in the range 5-9, and therefore
likely to be contaminated by the infrared cirrus, is shown in
an equal area Aitoff projection in Galactic coordinates.
larger
largest
|
|