IRAS Explanatory Supplement
VIII. Sky Coverage, Confusion, Completeness and Reliability
D. Point Source Catalog Reliability and Completeness
D.6 Galactic Plane Shadow
Chapter Contents | Authors | References
Table of Contents | Index | Previous Section | Next Section
 |
|
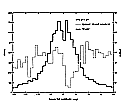
Figure VIII.D.2 The wavelength dependent effects of the Galactic plane
shadow discussed in the text are shown. The solid lines are counts of 12 µm
sources as a function of Galactic latitude; the dotted lines are counts. larger largest |
The strong lagging of the noise estimator at 100 and 60 µm after passage through the Galactic plane prevented the acceptance of a large number of sources because their calculated signal-to-noise ratio fell below the threshold. The effect is demonstrated in Fig. VIII.D.2 which shows counts of point sources in bins of 1° in latitude and 20° in longitude. The counts of sources seen only at 100 µm shows a decrease of about a factor of 10 just after the telescope scanned past the Galactic equator in the first two HCON coverages. This dearth of sources is called the Galactic plane shadow and takes roughly the form of two rectangular strips. The first extends from Galactic longitude l = 10° to 30°, and from Galactic latitude b = 0° to 5°, and the second extends from l = 330° to 350°, and b = 0° to -5°.
During the third HCON survey the telescope passed the Galactic equator in the opposite direction. Although many 60 and 100 µm sources were found in the shadow area, they were seen only on one HCON and were thus excluded from the catalog.
The noise shadow is far less important at the shorter wavelengths. The
counts of the 12 µm sources shown in the figure are highly symmetric
around b = 0°, but show a small 10% dip in the central two bins.
The cause of this dip is probably the high source density clean up (see
Section V.H.6) and not the noise lag.
Table of Contents | Index | Previous Section | Next Section