ISSA Explanatory Supplement
II. IRAS SKY SURVEY ATLAS OVERVIEW
B. Overview of Calibration
- Point Source Calibration Method
- Spatial Frequency Response
- Detector Effective Solid Angles
- Zero Point Calibration
- Calibration Limitations for Extended Sources
B.1 Point Source Calibration Method
The brightness scale of the IRAS detectors was set in a three-step process. First, the point source calibration of the 12 µm IRAS survey detectors was tied to the ground-based 10 µm absolute calibration by Rieke et al. (1984) via measurements of Tau. This calibration was extrapolated
to 25 and 60 µm using stellar models. The extrapolation from
60 to 100 µm was based on observations and model calculations
of asteroids. Details of this process are presented in Chapter VI of
the Main Supplement. No changes have been made to the IRAS
absolute point source calibration for ISSA.
Tau. This calibration was extrapolated
to 25 and 60 µm using stellar models. The extrapolation from
60 to 100 µm was based on observations and model calculations
of asteroids. Details of this process are presented in Chapter VI of
the Main Supplement. No changes have been made to the IRAS
absolute point source calibration for ISSA.
Calibration was then transferred to a secondary standard, NGC6543, and internal stimulators were used for short-term maintenance of the point source calibration. Details of this process are found in Chapter VI of the Main Supplement. A model was used to track the point source responsivity of the detectors between internal stimulators. A number of improvements to this model were made and are detailed in §III.A.2.
B.2 Spatial Frequency Response
As mentioned above, the IRAS detector responsivities were monitored by the use of internal stimulators, which were flashed for a duration similar to that of a point source scanning across a detector at the survey rate. These flashes were calibrated to NGC6543 as discussed in Chapter VI of the Main Supplement. All data were scaled relative to the response to the flashes, thus accurately calibrating data to the point source frequency.|
|
|
Figure II.B.1(a) Measurements of the response
vs. dwell time to measure
frequency dependence of the detectors at 12 (top panel) and 25
(bottom panel) µm. The measurements were made either by
crossing a source at scan rates less than the survey rates or by
viewing long flashes of the internal reference source.
The upper horizontal scale has translated the dwell time of the lower
scale to spatial frequency using the IRAS survey scan rate of
3.85' s-1. larger largest |
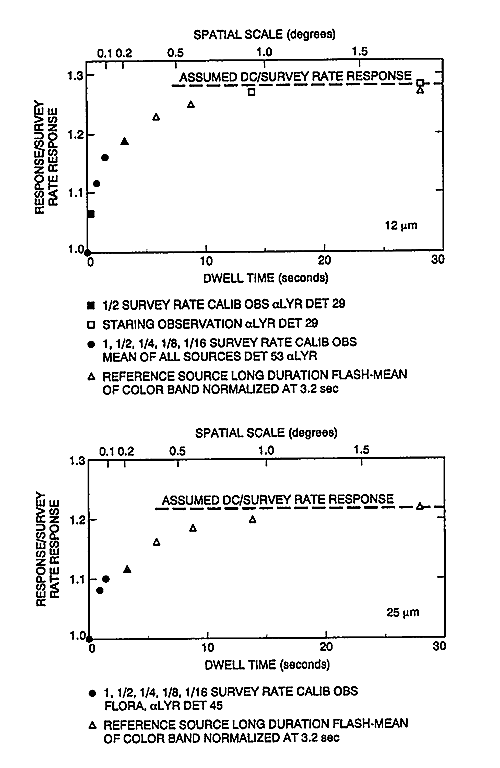
Longer exposure to point sources revealed a difference between the
short term (AC) and long term (DC) responsivity of the detectors,
suggesting that a correction to the point source calibration was needed
for extended source photometry. This correction was obtained by
measuring detector response as a function of dwell
time during the IRAS mission in an attempt to define the frequency
response of the IRAS detectors. Point sources were scanned
across the detectors at 1/2, 1/4, 1/8
and 1/16 of the survey scan rate. Measurements were extended
to longer periods, with flashes of the internal stimulators lasting
tens of seconds for
12 and 25 µm and by extended stares at point sources for 60 and
100 µm.
Some of these measurements are shown in Figures II.B.1(a)-(c),
which is reproduced
from Figure IV.A.4 of the Main Supplement. The temporal response shown
in Figures II.B.1(a)-(c) is translated into a spatial
frequency response using the
IRAS survey scan rate of 3.85' s-1.
|
|
|
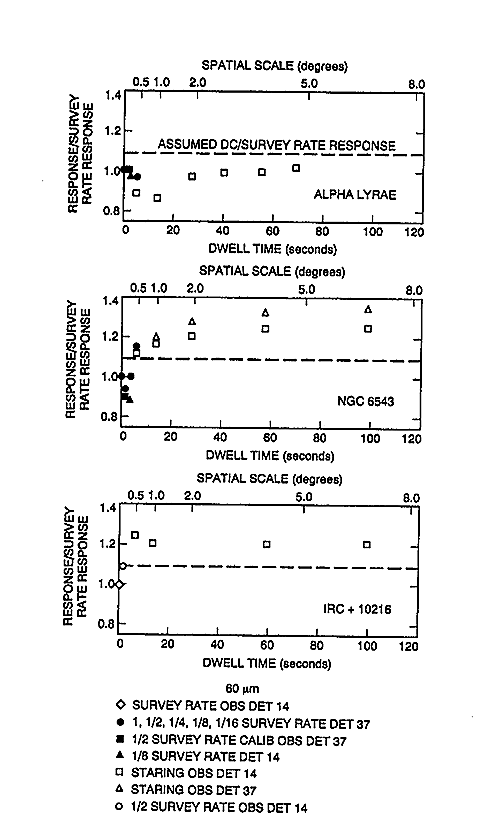
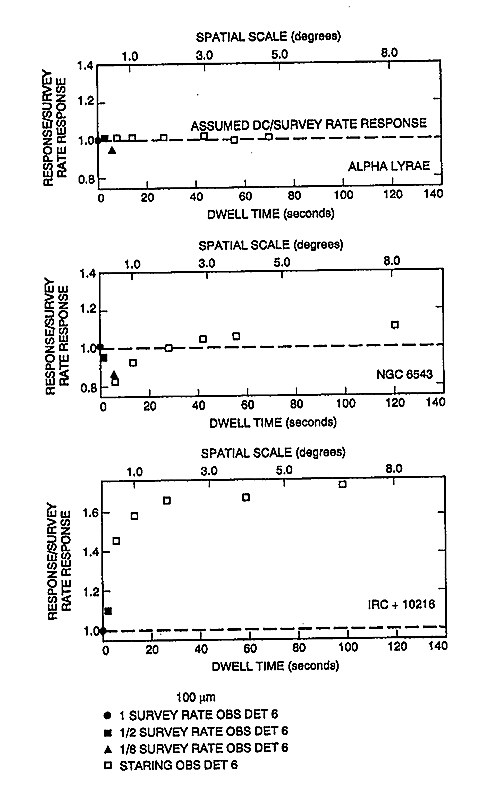
Figure II.B.1(b) Measurements of the response vs. dwell time to measure
frequency dependence of the detectors at
60 µm. The measurements were made either by
crossing a source at scan rates less than the survey rates or by
viewing long flashes of the internal reference source.
The upper horizontal
scale has translated the dwell time of the lower scale to spatial
frequency using the IRAS survey scan rate of
3.85' s-1. larger largest |
No attempt was made to perform a true frequency response correction
for the ISSA data.
Instead, the point source calibration was multiplied
by a single factor
in each band in order to best represent the surface brightness at
large spatial scales (>2° at 12 and 25 µm and >5°
at 60 and 100 µm). The factors were
0.78, 0.82, 0.92 and 1.00 at 12, 25, 60 and 100 µm, respectively.
ISSA and the ZOHF products are therefore DC calibrated.
To recover the correct brightness on the smallest spatial scales
(point sources), the inverse of these factors should be applied
to the total flux measured.
The correction factors for intermediate spatial scales can be determined
for 12 and 25 µm from Figure II.B.1(a). Suggested corrections for
12 and 25 µm
are found in Table II.B.1.
|
|
|
Figure II.B.1(c) Measurements of the response vs. dwell time to measure
frequency dependence of the detectors at
100 µm. The measurements were made either by
crossing a source at scan rates less than the survey rates or by
viewing long flashes of the internal reference source.
The upper horizontal
scale has translated the dwell time of the lower scale to spatial
frequency using the IRAS survey scan rate of
3.85' s-1. larger largest |
| Spatial Scale (deg) | Multiplication Factors* | |
|---|---|---|
| 12 µm | 25 µm | |
| 0.1 | 1.15 | 1.10 |
| 0.2 | 1.18 | 1.13 |
| 0.5 | 1.25 | 1.18 |
| 1.0 | 1.28 | 1.20 |
| 1.5 | 1.28 | 1.23 |
| 2.0 | 1.28 | 1.23 |
While the frequency response of the detectors at 12 and 25 µm
was clear, no consistent measurement was obtained for 60 and 100 µm.
Figures II.B.1(b) and II.B.1(c)
suggest a nonlinearity which makes the frequency response at 60 and
100 µm dependent on brightness.
The uncertainty in the overall linearity of the
photometric scale at the long wavelengths
results in photometric uncertainties of about 30% and 60% for
extended sources at 60 µm and 100 µm,
respectively.
B.3 Detector Effective Solid Angles
After the data were corrected for frequency response of the detectors and their electronics as discussed in §II.B.2, the effective solid angle of each detector was used to yield the average surface brightness over the field of view (Main Supplement §IV.A.3). The solid angle values used for ISSA have improved since the SkyFlux release in 1986 and are discussed in §II.D.2 of the Explanatory Supplement to the Faint Source Survey. The magnitude of the difference is given in §III.A.2.c.B.4 Zero Point Calibration
The zero point of the IRAS calibration was set and maintained by reference to an area of sky free from point sources near the north ecliptic pole and NGC6543 (the secondary calibration standard Main Supplement §VI.B), which was accessible throughout the entire IRAS mission. This area was called the Total Flux Photometric Reference or TFPR. The TFPR was observed daily using the special calibration observation CS-15. The total signal from each detector was compared to the brightness model for the TFPR (§III.A.2.b) and the difference between the measured and predicted electrical signal was ascribed to the electronic offset. The value of the electronic offset used for correction of the zero point in survey observations was obtained by linear interpolation between offsets obtained during these measurements of the TFPR. This process is described in more detail in §VI.B.3 of the Main Supplement. The accuracy of the IRAS zero point is dependent on the accuracy of the TFPR brightness prediction (§III.A.2.b).
The TFPR model was derived based on a TFPR position of
 = 89.2° and
 = 94.6° where
and represent ecliptic latitude and ecliptic
longitude, respectively.
However, due to the method by which the CS-15
calibration observations were executed,
the actual position observed as the TFPR
varied slightly throughout the mission.
The observed position
of the TFPR varied between
= 88.8°, = 268.9°
and = 89.2°, = 95.0°
depending on the scan direction past NGC6543 at
= 89.8°, = 150.3°.
NGC6543 was used in the point source calibration as a
secondary transfer standard
(Main Supplement §VI.B).
Although this caused discrepancies in the derived
offsets, it is not considered a major source of error.
The variation in flux among the TFPR locations is roughly
0.03%, 0.5%, 0.2% and 1.9% at 12, 25, 60 and 100 µm, respectively,
of the absolute zero point as assumed by the TFPR model,
§III.A.2.b.
= 94.6° where
and represent ecliptic latitude and ecliptic
longitude, respectively.
However, due to the method by which the CS-15
calibration observations were executed,
the actual position observed as the TFPR
varied slightly throughout the mission.
The observed position
of the TFPR varied between
= 88.8°, = 268.9°
and = 89.2°, = 95.0°
depending on the scan direction past NGC6543 at
= 89.8°, = 150.3°.
NGC6543 was used in the point source calibration as a
secondary transfer standard
(Main Supplement §VI.B).
Although this caused discrepancies in the derived
offsets, it is not considered a major source of error.
The variation in flux among the TFPR locations is roughly
0.03%, 0.5%, 0.2% and 1.9% at 12, 25, 60 and 100 µm, respectively,
of the absolute zero point as assumed by the TFPR model,
§III.A.2.b.
B.5 Calibration Limitations for Extended Sources
The zero point calibration was severely limited by our knowledge of the absolute flux and the annual variation of the TFPR. This is not a major problem since the ISSA images are not intended to provide accurate absolute photometry. Uncertainties for the TFPR model are found in §III.A.2.As discussed in §II.B.2, the IRAS scan data were not corrected for all spatial frequencies. Features in the ISSA with spatial scales less than 2° at 12 and 25 µm and less than 5° at 60 and 100 µm appear too faint. The correction factors for point sources are given in §II.B.2. Suggested correction factors for intermediate spatial scales are found in Table II.B.1. Large uncertainties, 30% and 60% at 60 and 100 µm, respectively, exist in the factors for spatial scale corrections. This uncertainty in the frequency response of IRAS at long wavelengths is the major source of uncertainties in the absolute calibration of ISSA. The user is directed to a careful reading of §II.B.2 and examination of Figures II.B.1(b) and (c) before attempting to perform photometric corrections for spatial scales at 60 and 100 µm.