Data Retrieval
|
 |
 Oasis Main
Window Oasis Main
Window
When Oasis first comes up, the user sees a blank map
display window and a set of controls for accessing the
Oasis archive search and data manipulation functionality.
Any FITS image file can be opened from the local disk or an
image can be retrieved from any one of several servers.
Similarly, corresponding catalog data can be retrieved from
IRSA or CDS. All these functions (and most of the rest
described below) are accessible through icon buttons on the
main window. |
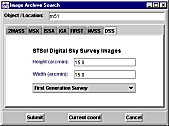 |
 Image Archive
Search Window Image Archive
Search Window
Image archive access is handled through an integrated
combination of general and specific search criteria. This
form allows the user to enter an object name or location
and specify where to save the resulting FITS file. Tabbed
subpanels provide the mechanism for selecting which image
set to search and allow for archive-specific search
criteria. |
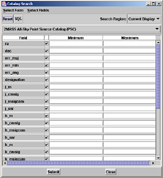 |
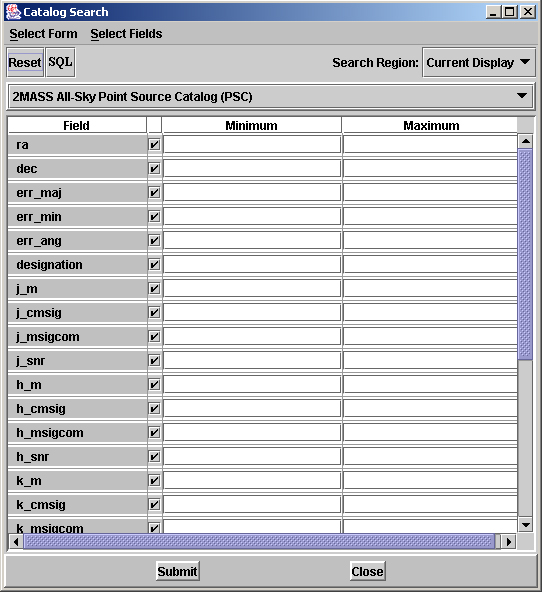
  Catalog Archive
Search Windows Catalog Archive
Search Windows
The second, third and fourth buttons on the main window
provide a means for users to search catalog archives at
IRSA and CDS (VIZIER) and perform a region search using
NED. All three return a source table (which will then be
automatically overlayed as a map on any image displayed).
IRSA and CDS also allow relational search constraints in
addition to sky region constraints (in the case of IRSA,
the sky constraints are optional and full SQL can be used
if necessary to allow AND and OR constructs). |
 |
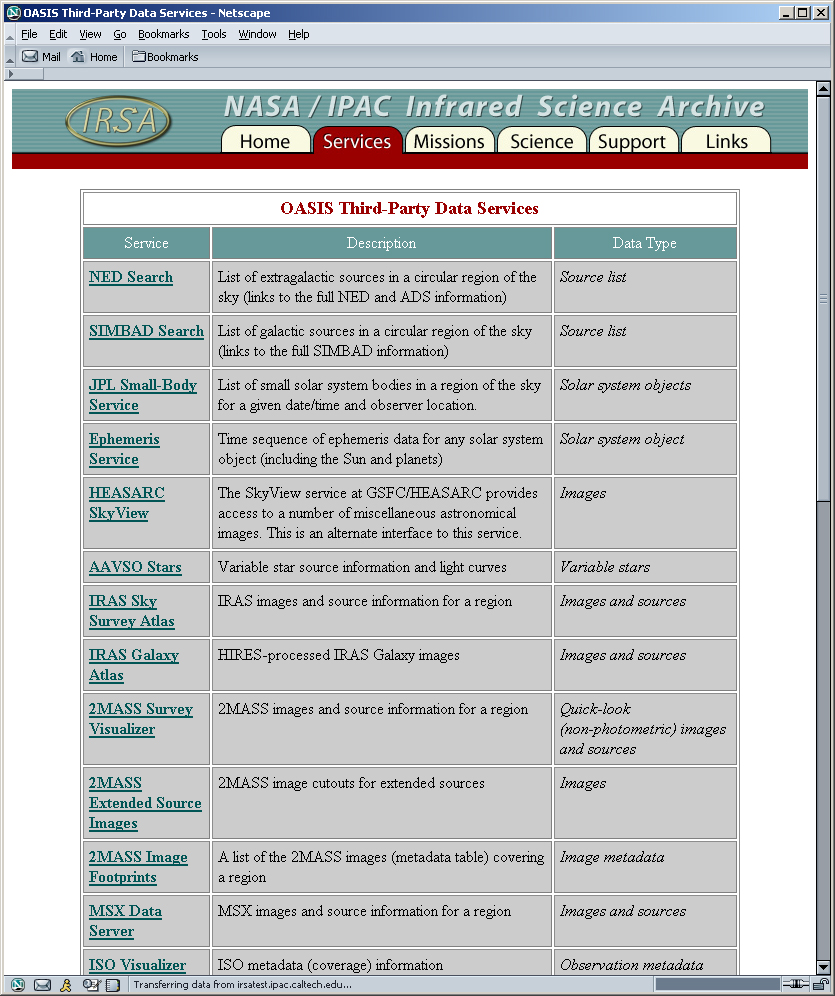
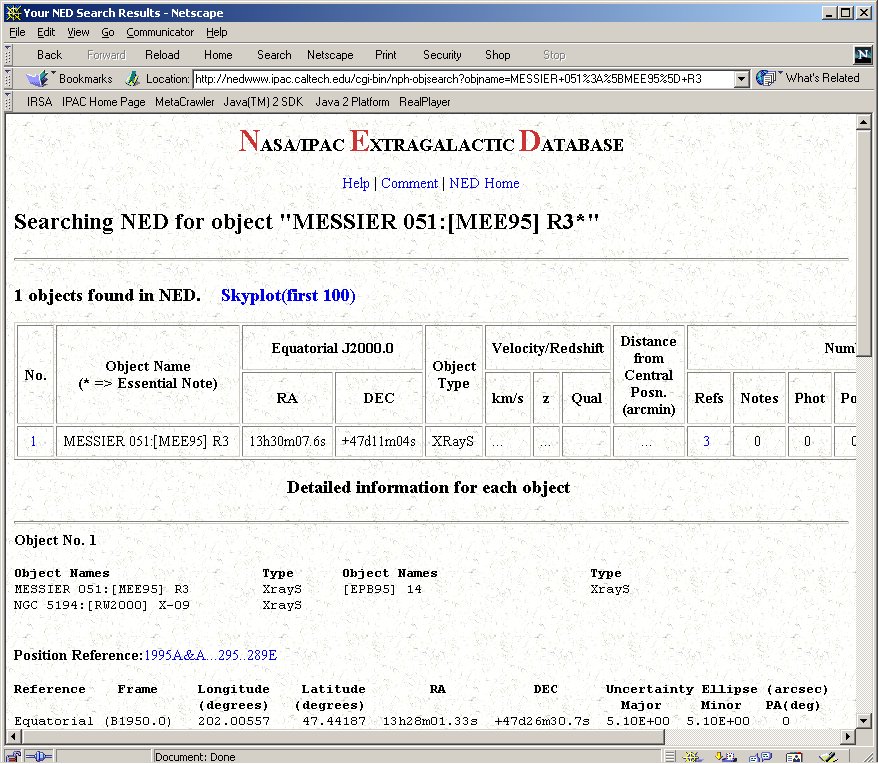
 Third-Party
Services Third-Party
Services
Oasis provides an open-ended mechanism that any data owner
or service provider can utilize to make their information
available using the Oasis toolkit. Since we cannot know all
the ways in which Oasis is being used, the list provided
here simply represents a snapshot of those services we
currently know about. |
Local Data Processing
|
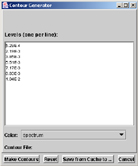 |
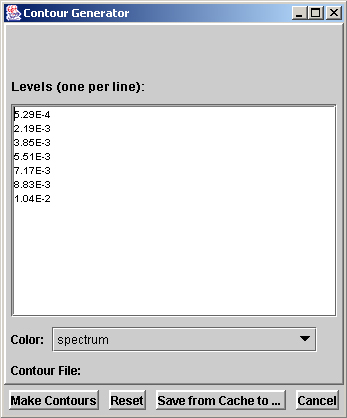
 Contour Generation
Oasis includes a general "sky drawing" capability based on
an XML dialect (not yet finalized). On top of this, we have
built a tool which takes an image as displayed and, using
the data range chosen by the user as a starting point,
generates a contour file. Since this file is drawn in sky
coordinates, it can persist as an overlay even if the
underlying image is changed. |
 |
 Image Subsetting / Resampling
In order to deal with very large images, we provide a
mechanism for interactively cropping out a region of
interest and/or subsampling the data (i.e. reading
every nth pixel/line. This has the same effect
visually as zooming/panning the full image. |
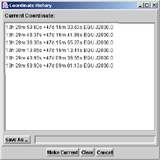 |
Coordinate History
Oasis provides a straightforward mechanism for maintaining
a coordinate history. The user can save the "current
location" (the last point selected on the image or in a
table) to a memory list, use this last-saved location in a
variety of places (archive search GUIs, on third-party Web
forms), or view/edit the complete history and save it to
disk. |
Control / Information Windows
|
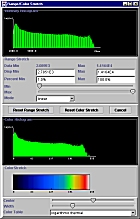 |
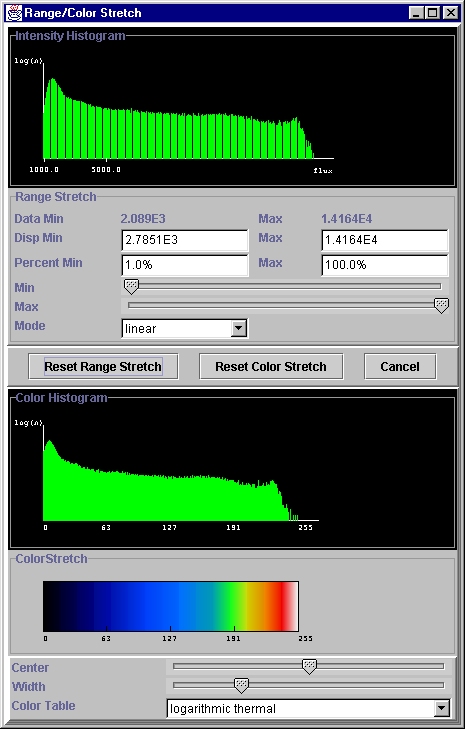
 Color Control
All the standard functionality is available for controlling
the details of the display. Data stretching can be based on
absolute values or percentiles of the data itself, and the
user can switch easily between the two. Color stretching
can be either to specific values or done
interactively. |
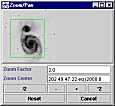 |
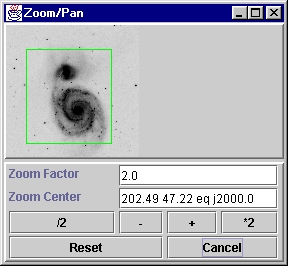
 Zoom/Pan
Zoom/pan functionality is provided through a pop-up which
presents a small version of the whole image plus an outline
of the portion currently displayed in the main window.
Fractional zoom factors (e.g. 1.75) are
allowed. |
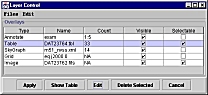 |
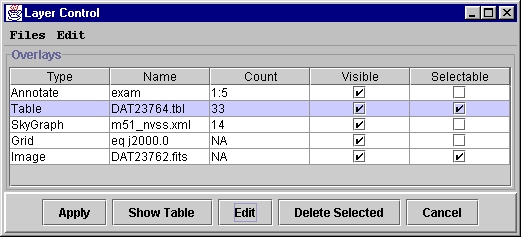
 Layer
Control Layer
Control
Data overlaid on the images (source maps, coordinate grids,
contour plots, etc.) are handled as a set of map
layers and controlled through the Layer Control
window. From here, for instance, the user can modify symbol
sizes, etc. for map overlays. They can also ask that
the tables that were used to make the map be shown. Sources
selected in the table can be highlighted on the image (and
vice versa). |
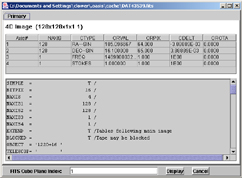 |
FITS Header Display
Oasis will display a summary of the information in any FITS
file (including extensions). This tool will be eventually
be used to allow access to extension data and planes in
data cubes, though this capability is not yet
available. |
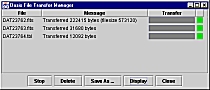 |
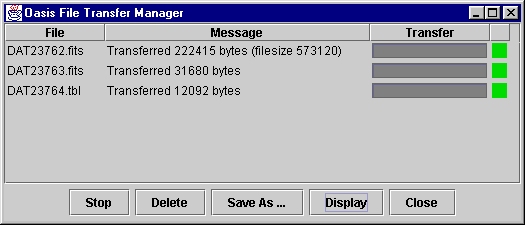
 Request Management
All data requests (whether from the Oasis custom archive
search functionality, data references in tables, or from
third-party services) are handed off to a centralized
request manager. Since our current services are simple
URL data requests, this is instantiated in a File
Transfer Manager front-end through which the user can
monitor all outstanding data requests and control (cancel
or redirect) their progress.
There is an active project at IRSA to implement a more
involved Request Management service (for handling lengthy
processing jobs among other things) and another to build
an integrated Data Collection interaction environment.
When these and Oasis are integrated together, the
functionality here will be greatly expanded.
|
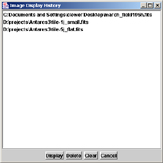 |
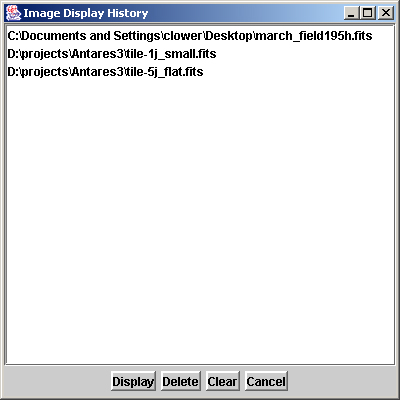
Show Image History
Users frequently wish to quickly switch back and forth
between two or more different images. Oasis provides an
"image history" window which lists the various image
files which have been viewed and remembers the details of
the display in each case.
For example, if the user first displays a DSS image of
M31 adjusting the color table, stretch, zoom, etc. then
displays a 2MASS image of the same region with a
different color table, stretch, zoom, etc., the image
history will remember and reset all the display details
as the user switches back and forth. This works for any
number of images.
|
|
Show Selected Source Info
Oasis maintains and can display many source tables as
overlays to the current image. When a user selects a
location on the sky or region, all of the sources in that
region are marked in their respective tables. With many
tables, however, the screen rapidly becomes too cluttered
for this to be effective so Oasis does not display tables
unless asked.
Instead, a special "source info" window pops up. In
this window the user can see all of the information for a
single table record (arranged vertically as field=value
pairs rather than horizontally) and can step forward and
backward through this list.
|
Data Layer Interaction
|
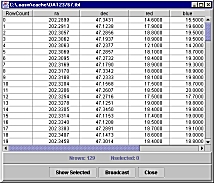 |
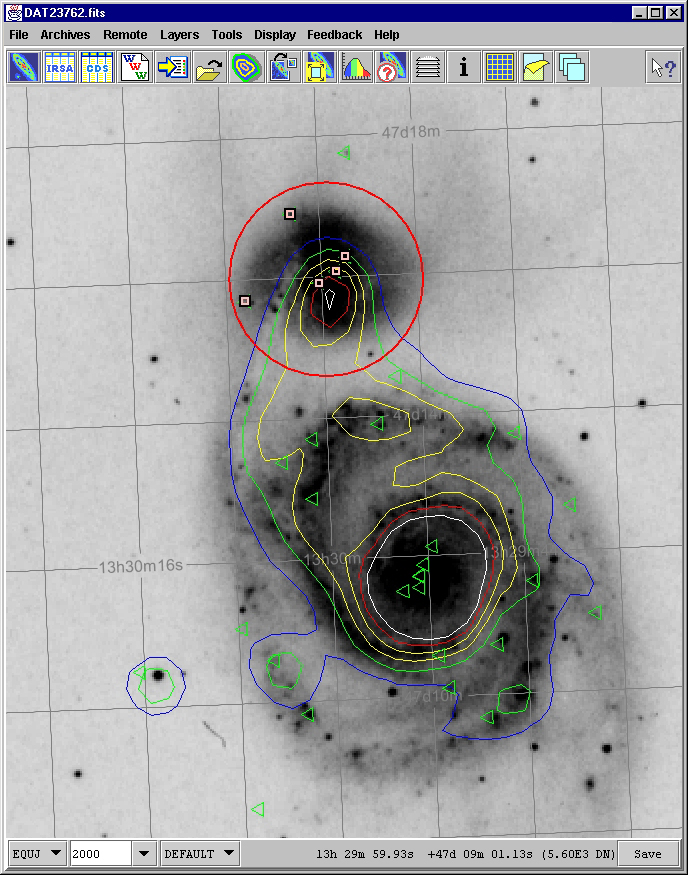
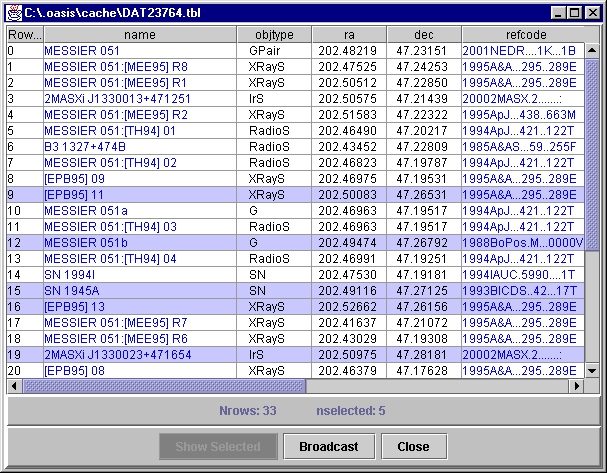
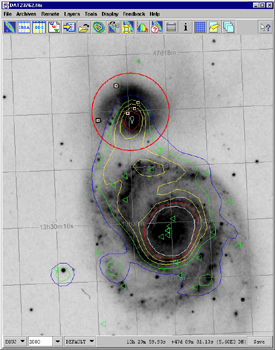
Catalog Table Display
The table retrieved through the catalog search form and
controlled using the Layer Lontrol window is shown at
left. The details of how it is rendered can be set
through Layer Control.
When the user selects a location on the display or an
area of interest, the system interrogates all active
layers. In this case the area of interest is being set
through an area examination window. Information about the
image for this region is shown, but since the table map
layer is also active, all the sources covered by the
circle are also marked (both on the image and in the
table).
|
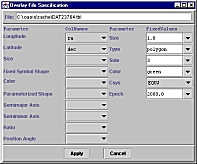 |
Map Symbol Control
From the Layer Control window, once a table layer has been
selected, the way in which the map is constructed (symbol
color, shape, size, etc. can be specified through
this window (brought up through the "Edit" button on Layer
Control). |
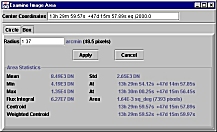 |
 Layer Feedback
When the feedback mode is set to area, or when a position
is specified (via the Feedback pulldown or the area
examination button) and an area defined, all layers that
are selectable (e.g., the background image and all
active tables) are queried for information. For the image,
the result is area flux statistics (shown at left). For the
tables, all appropriate sources are marked in the table
(the highlighted records in the table above) and on the map
(the black and white boxes overlaying the source symbols on
the main window). |
|
Rescale Overlay Grid
For effiency, the coordinate grid is only computed for the
region of the image which is currently displayed. As the
user zooms or pans, this tool (under the Display menu)
allows them to recompute this overlay on demand. |