Document version: 14 September 2007
2.0 Observations
3.0 Data reduction
4.0 Data products
Tables:
Other information:
Figures:
This document describes the second release of data products from the Far-Infrared Deep Extragalactic Legacy Survey (FIDEL), a Spitzer Space Telescope Legacy Science program (PI: Mark Dickinson, NOAO).
This data release (DR2) consists of observations for all three FIDEL survey fields:
The imaging data products are described in detail below, and consist of a science image mosaic at each wavelength plus associated exposure and noise maps.
FIDEL is Spitzer program ID (PID) number 30948, and was originally submitted with the title "A Deep-Wide Far-Infrared Survey of Cosmological Star Formation and AGN Activity." The program is obtaining data in three fields on the sky. Most of the data come from two fields, the Extended Chandra Deep Field South (ECDFS) and the Extended Groth Strip (EGS). Additional data are also being obtained in the GOODS-North area, in order to augment partial 70 micron coverage of that field from a GO-1 program (PID 3325, see Frayer et al. 2006b, ApJ, 647, L9). The observing strategies and data reduction are different for the three fields, and we discuss them each separately below.
Spitzer MIPS observations are now organized into "warm" and "cold" campaigns, in order to maximize the cryogenic lifetime of the telescope. "Cold" campaigns result in greater cryogen usage, and provide a lower background to allow 160 micron observations to be taken. The only cold campaign 160 micron data for FIDEL that have been reduced so far are those for EGS epoch 1, which are presented here.
The design of the AORs for the FIDEL MIPS observations is somewhat complex, and we will only give a high-level description here. Please refer to the Spitzer Observer's Manual for detailed explanations of the various observing modes and terminology. The target coordinates observing dates for the MIPS observations used in this data release are summarized in Table 1, which also provides links to detailed information about the AORs that make up each block of observations.
Observation | Spitzer program ID | RA (J2000) | Dec (J2000) | Start date | End date | AOR summary |
---|---|---|---|---|---|---|
ECDFS FIDEL epoch 1 photometry mode | 30948 | 03:32:30.37 | -27:48:19.3 | 2006-09-01 | 2006-09-05 | AORs |
ECDFS FIDEL epoch 2 photometry mode | 30948 | 03:32:30.37 | -27:48:19.3 | 2007-03-01 | 2007-03-07 | AORs |
GOODS-N FIDEL photometry mode | 30948 | 12:36:58.41 | +62:14:41.1 | 2006-12-04 | 2006-12-06 | AORs |
EGS FIDEL epoch 1 scan mode | 30948 | 14:20:05.0 | +52:58:00.0 | 2007-01-14 | 2007-01-18 | AORs |
EGS GTO first observation, scan mode | 00008 | 14:19:00.0 | +52:46:00.0 | 2003-12-28 | 2003-12-30 | AORs |
EGS GTO second observation, scan mode | 00008 | 14:19:00.0 | +52:46:00.0 | 2004-06-19 | 2004-06-20 | AORs |
The bulk of the FIDEL ECDFS observations were taken in two epochs separated by approximately six months, in September 2006 and March 2007 (epochs 1 and 2, respectively). The Spitzer telescope orientation rotated by approximately 180 degrees between the two epochs, ensuring reasonably symmetric coverage in the MIPS 24 and 70 micron bandpasses. Data release DR2 presents the combined image from the first and second epoch FIDEL data at 24 and 70 microns. (An earlier reduction of the first-epoch data was released in DR1.) Additional MIPS scanning observations of the ECDFS were taken during cold campaigns in January and March 2007, and will provide 160 micron coverage for FIDEL, as well as additional depth at 24 and 70 microns. Those data will be included in the FIDEL 'v1.0' data products, planned for release in June 2008. The September 2006 observations were taken during a warm campaign, and therefore no 160 micron data were taken. The March 2007 observations were done cold, but using the photometry mode AOT (see below) optimized for 70 microns. They are therefore not ideal for the 160 micron parallel data, which are also spatially offset from the main target field. Those 160 micron data have not been reduced by the FIDEL team.
The observations were broken into a series of Astronomical Observation Requests (AORs), each several hours long, that were designed to enable efficient scheduling. For the first epoch of ECDFS observations, we had 27 AORs, falling into two basic types. The majority (24 out of 27) of the AORs were taken with the 70 micron array as the prime instrument (henceforth, "70-prime"), with the observing strategy optimized for that wavelength. These AORs have TARGET=ECDFS. Three other AORs were taken with the 24 micron array as the prime instrument ("24-prime"). These AORs have TARGET=ECDFS-mips24, and were used to fill gaps in the 24 micron areal coverage, for reasons described in more detail below. In the second epoch, there were 24 AORs, all taken with the 70 micron array as the prime instrument.
All ECDFS epoch 1 and 2 MIPS observations used the photometry-mode Astronomical Observing Templates (AOTs), which are described in more detail in section 8.2.1.2 of the Spitzer Observer's Manual. In this mode, the field of view is dithered using a combination of telescope and scan mirror offsets around a particular pointing position. The 70-prime AORs used the 70 micron compact source (small field) mode, while the 24-prime AORs used the 24 micron large source (large field) mode.
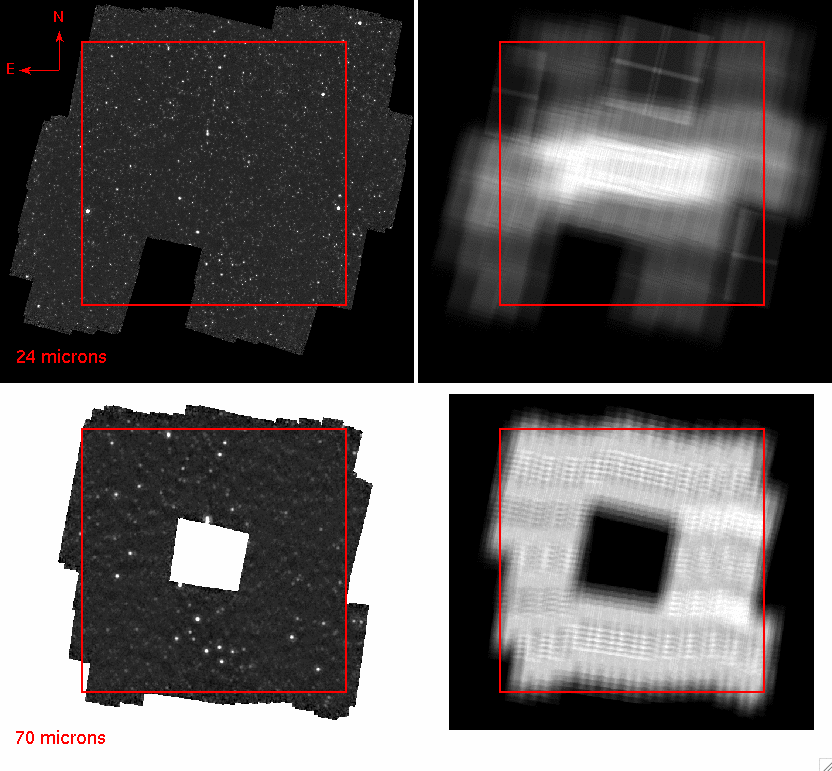
Generically, we consider the ECDFS to cover a square region approximately 30'x30' on the sky, oriented along the J2000 celestial axes. In the first epoch, the 70-prime AORs observed pointing positions that covered roughly the bottom two-thirds of the 30'x30' ECDFS. The parallel 24 micron data taken at the same time covered roughly the upper two thirds of the field. This situation was reversed by 180 degrees for the second epoch observations, providing roughly symmetric coverage of the field. The 70 micron pointings were carefully placed to avoid overlap with previous, deep 70 micron observations taken in a GO-2 program (PID 20147, PI: D. Frayer) which observed roughly the central 10'x10' of the GOODS-South field. This leads to the hole in 70 micron coverage seen in Figure 1, and also the "notch" on the southern portion of the 24 micron mosaic. These will be filled with the (currently proprietary) data from PID 20147, and a complete, combined image (also incorporating additional scanning mode data from FIDEL and from previous GTO programs) will be released as a "version 1.0" data product circa June 2008.
The MIPS observations were optimized to achieve roughly uniform exposure time at 70 microns in the combined epoch 1 + 2 observations. This, however, leads to non-uniformity in the depth of the parallel 24 micron observations, which are generally deepest in an E-W strip through the middle of the field, and somewhat shallower toward the northern and southern extremes. By avoiding the central field targeted by the Frayer 70 micron GO-2 program, we also introduce some gaps in the 24 micron coverage. These, as well as some "protruding corners", were filled by the additional 24-prime AORs, which were taken in epoch 1.
Figure 1 illustrates the layout of the ECDFS epoch 1+2 observations, showing the MIPS images and the relative exposure time maps at 24 and 70 microns. In the DR2 ECDFS 70 micron images, the mean exposure time over the majority of the field is approximately 4800s. This will be increased to approximately 7200s when the additional FIDEL scanning data and GTO observations are incorporated in a future data release. At 24 microns, the exposure time varies more. The deepest region in the central area has net exposure time approximately 24500s. Shallower regions have typical exposure times from 5800 to 11600s, while regions covered by the 24-prime "filler" AORs range from 2000s to 3400s. The median 24 micron exposure time within the nominal 30'x30' ECDFS area (excluding regions with no data) is approximately 8000 seconds in the DR2 images.
2.2 Extended Groth Strip (EGS):
The Extended Groth Strip (EGS) has extensive multiwavelength observations with many ground- and
space-based observatories. Together, these comprise the
(All-Wavelength Extended Groth strip International Survey (AEGIS)),
of which FIDEL is one component. Previous Spitzer observations of the EGS include IRAC and
MIPS data taken with guaranteed time invested by the Instrument Teams. The complete
two-epoch FIDEL MIPS observations of the EGS will have a typical exposure time approximately
12 times longer than the GTO MIPS observations of this field. DR2 provides data products from the
first epoch of FIDEL EGS observations, and thus has roughly half of the final planned exposure
time. The second epoch observations have just been obtained and are now being reduced.
The EGS is a long, narrow strip on the sky, oriented at a position angle of approximately 40 degrees
(E of N). The elongated geometry favors the use of scan mode AOTs (see section 8.2.1.1 of the
Spitzer Observer's Manual),
in which Spitzer scans back and forth along a given direction, with cross-scan offsets.
The EGS observations were also taken in two epochs, in January and July 2007, with the
telescope orientation reversed by 180 degrees. The observations required very tight timing
constraints on the observations, which were met quite precisely by the SSC schedulers.
The first epoch EGS observations (released here) consisted of 32 AORs.
The goal for the FIDEL EGS observations was to obtain full depth exposures at three MIPS
wavelengths (24, 70 and 160 microns) for an overlap region approximately 90 arcmin long
and 10 arcmin wide. The separation on the sky of the fields of view for the three MIPS
channels leads to displaced coverage at the three wavelengths in a single epoch, with the
pattern reversed in the second epoch observations. The final, coadded two-epoch data
set will have roughly symmetric coverage with full 3-band depth over the 10'x90' primary
field, and shallower "overscan" regions extending beyond it.
The EGS was previously observed with MIPS as part of the guaranteed time observer program
(PID 8, PI: Fazio). These earlier, shallower data have been used in a variety of scientific
investigations, including papers published in the AEGIS Special Issue of the ApJ Letters.
As part of a general public release of AEGIS data sets, we have combined the GTO observations
taken in December 2003 and June 2004 with the FIDEL data for this data release. The December 2003
MIPS data were taken very early during Spitzer's operations, and the telescope entered
safe-mode partially through the observations, causing them to abort; 4 AORs and an incomplete 5th
were obtained. The observations were rescheduled for June 2004, when 12 AORs were executed.
Both of these GTO observations are somewhat misaligned with the axis of the FIDEL data.
The GTO scans also were longer than the FIDEL scans, covering 120 arcmin (plus overscans).
This provides coverage of additional area, primarily at the southwest end of the EGS.
Figure 2 illustrates the combined FIDEL epoch 1 + GTO observations,
showing the MIPS images and the relative exposure time maps at 24, 70 and 160 microns.
The FIDEL area can be distinguished in the exposure maps as the region with deeper coverage.
In the DR2 EGS 70 micron images, the mean exposure time in the deeper FIDEL area
(including the GTO data used here) is approximately 3800 seconds. This will be increased
to approximately 7200s when the second epoch FIDEL observations are incorporated
in a future data release. The corresponding exposure time at 160 microns is
about 700 seconds, while at 24 microns it is about 7200 seconds, both of which will
be roughly doubled in the final data products.
2.3 GOODS-North:
Approximately 100 square arcmin in the northern field of the
Great Observatories Origins Deep Survey (GOODS))
was observed with MIPS at 70 microns in a cycle 1 guest observer program (PID 3325, see
Frayer et al. 2006b, ApJ, 647, L9).
Those were the first very deep field observations taken with MIPS, with a typical exposure time
of approximately 3 hours per position, covering approximately the central 10 arcmin x 10 arcmin
region of the GOODS-N field. As part of FIDEL, we have obtained additional 70 micron observations
with similar net exposure time to extend the coverage to the northeast and southwest, in order to
cover the complete 10'x16' GOODS-N area.
In DR2, we provide mosaics of the FIDEL 70 micron data for GOODS-N, illustrated in
Figure 3. The typical exposure time at 70 microns is
approximately 9000 seconds. 24 micron observations were taken in parallel
with the 70 micron data, but are offset beyond the area of the
nominal GOODS-N field, and have not yet been reduced.
(24 micron observations of the GOODS-N field proper are available as
GOODS Legacy data products.)
The FIDEL GOODS-N observations were taken in photometry mode during a warm Spitzer
campaign, and no 160 micron data were taken. The version 1 FIDEL data products,
to be released in June 2008, will incorporate all MIPS data that are available for
the GOODS-N area, including the Frayer GO data and observations from the MIPS GTO program.
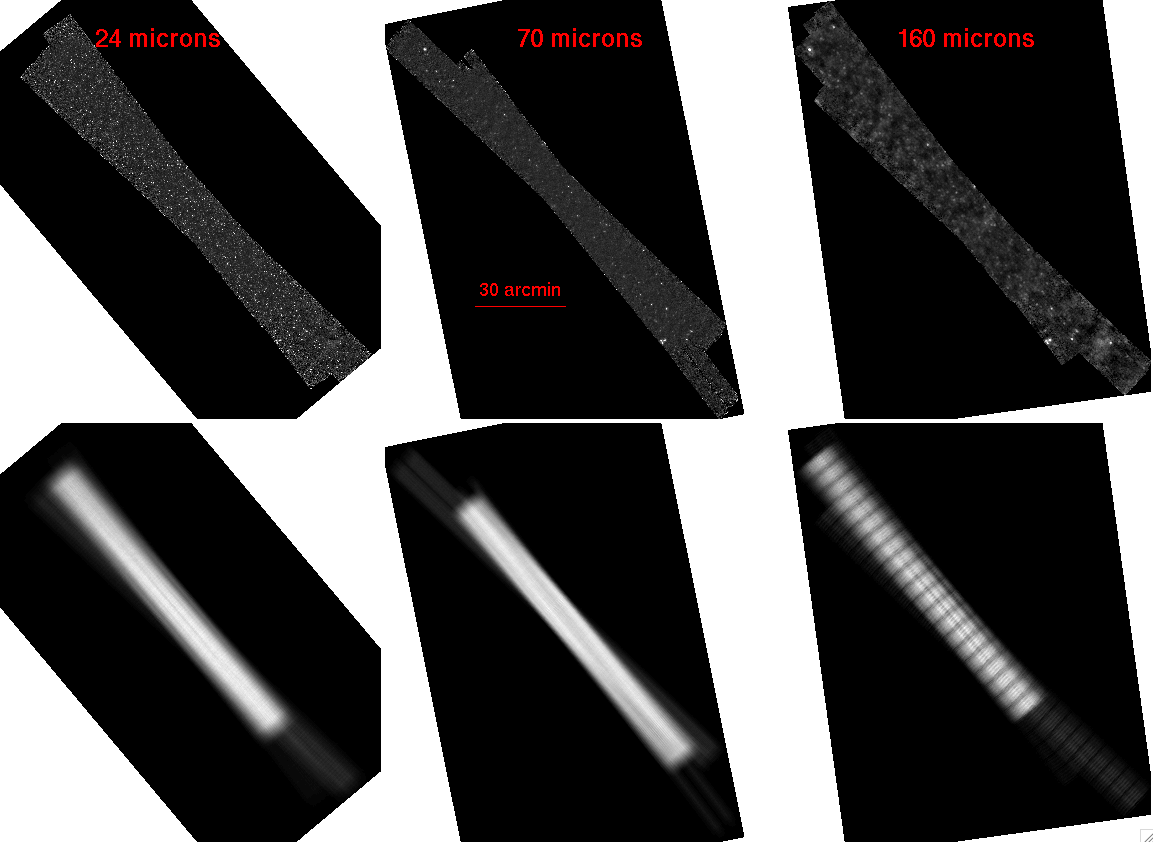
Figure 2: Extended Groth Strip FIDEL epoch 1 + GTO MIPS observations
The 24, 70 and 160 micron images are shown in the top row, and their corresponding
exposure maps are shown below.
The deeper area covered by the new FIDEL observations is easily seen in the exposure maps.
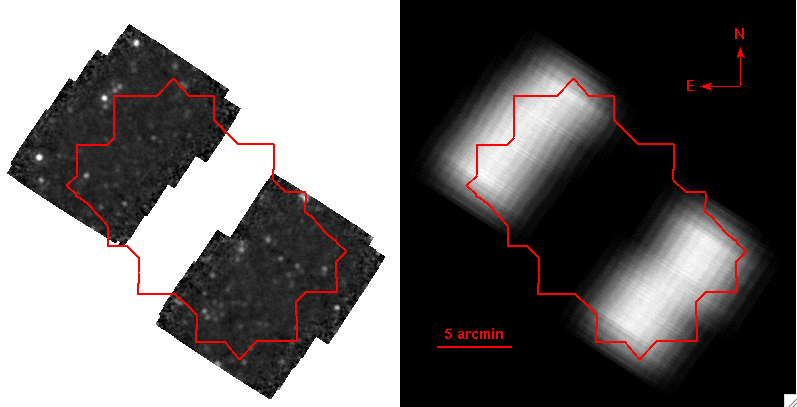
Figure 3: GOODS-North FIDEL MIPS 70 micron observations
The 70 micron FIDEL data are shown at left, and the corresponding
exposure map is shown at right.
The outline of the GOODS-N ACS mosaics is indicated schematically.
In a future FIDEL data release, the central region of GOODS-N will be filled
with 70 micron data from Frayer et al. GO-1 program PID 3325
DR2 consists of "best effort" early reductions of the FIDEL data sets. We expect improvements in future data products as we have time to experiment with variant methods and techniques, and as additional data are incorporated. In this release, we have not aimed for complete consistency between the reductions for the different FIDEL survey fields, as the reductions were done at different times (as the data came in) by different subsets of the FIDEL team.
Data reduction for the Ge:Ga arrays at 70 and 160 microns requires careful treatment
of a variety of time-dependent effects, as described in detail in
Gordon et al. 2005
and in the MIPS Data Handbook.
For the products in this data release (DR2), the ECDFS and GOODS-N 70 micron data were
reduced by FIDEL team members at the Spitzer Science Center, whereas the EGS 70 and 160
micron data were reduced at the University of Arizona, using different software.
In many respects, the data reduction methods used for the different data sets are quite
similar, but the details may differ, and the exact form of the final data products
(e.g., pixel scales, flux units) differ between the fields. We note these differences
in the documentation that follows.
The filtered BCD (fbcd) products for the ECDFS and GOODS-N fields were downloaded
from the Spitzer archive to make a quick-look image and an initial source
list. The raw data were then re-reduced from scratch using the
Ge Reprocessing Tools
(GeRT, version 060415 [2006 April 15]). The GeRT BCD processing was done with
the best set of optimized pipeline parameters derived previously from deep
70 micron photometry data of GOODS-North
(see Frayer et al. 2006b).
Filtering is crucial for deep 70 micron photometry data. The calibration
stimulator (stim) flashes are used every 6 data collection events (DCEs),
and latents due to
these stim flashes accumulate over time. These latents correlate with
column. To remove stim flash latents, we used a median column filter.
After column-filtering, the residual drifts of the detectors as a
function of time were removed by the application of a median high-pass
time filter per detector (with a filter width of 16 DCEs). This
combination of filters has been shown to give the best sensitivity for
deep photometry data. The positions of bright sources in the BCDs
were flagged so that the filtering corrections were not biased by the
presence of sources. This has been shown to maintain point-source
photometry while removing the "side-lobe" artifacts seen in the on-line
filtered products
(see Frayer et al. 2006a, AJ, 131, 250).
The median
filtering techniques yield small offsets from zero in the average
level of the filtered-BCDs. These offsets correlate with the DCE
position within the stim cycle and were removed by subtracting the
median level from each fbcd. With offline
re-processing of the data, we have improved the sensitivity of the
products by more than 20% over the on-line filtered products.
3.1.1.2 Image combination and astrometry
The data were coadded onto a sky grid with a scale of 4.0 arcsec/pixel using the
MOPEX
mosaicing and source extraction software (version 030106).
The astrometry for the 70 micron data uses the default pointing solutions
from telescope telemetry without further correction. Typical
uncertainties in the Spitzer pointing solution from AOR to AOR are of order
1 to 1.5 arcsec, which is small compared to the 70 micron beam size and pixel scales.
We did refine the 24 micron pointing solution for the ECDFS (see section 3.2.3),
and may apply these refinements to the 70 micron data as well in future re-reductions.
The data values in the science image mosaics have units of MJy per steradian, as
for the SSC BCD data products. Surface brightness is preserved when the mosaics
are reprojected to a final pixel scale.
The data units are discussed in more detail in section 4.3.
The EGS observations taken with the Ge:Ga arrays at 70 and 160 microns were reduced and
mosaiced using the Data Analysis Tool (DAT) developed by the MIPS Instrument Team.
The procedures are described in detail in
Gordon et al. 2005,
and are generally very similar to those described above for the reductions
of the ECDFS and GOODS-N data, with a few differences in detail:
The 24 micron data for the ECDFS and EGS were reduced by the FIDEL group at NOAO,
using very similar procedures for both fields, which we describe below.
The GOODS team has previously released 24 micron images of GOODS-N, which were
reduced using similar procedures, although with significant differences as well.
See the documentation for the
GOODS Legacy data products
for details.
Reduction of the 24 micron data started with the products generated by the SSC
Basic Calibrated Data (BCD) pipeline. The BCD versions used for each data set
were: ECDFS epoch 1 (S14.4.0), ECDFS epoch 2 (S15.3.0), EGS epoch 1 (S15.0.5),
GOODS-N (S15.0.5), and EGS GTO epochs 1 and 2 (S14.4.0).
As was described in section 2.1, for ECDFS epoch 1 there are two distinct
types of 24 micron observations: 10 second exposures taken when the 70 micron array was the
prime camera, and 30 second exposures taken with the 24 micron array as the prime camera.
Each has its own dither pattern, and the reductions were treated separately where necessary.
For the ECDFS epoch 2 and for all EGS observations, the 24 micron data were taken with
10 second exposure times.
3.2.2 Frame-level post-BCD processing
In post-processing of the individual BCD frames, we applied the
following steps:
Create masks for latent images:
Bright sources observed with MIPS can produce latent images that persist
into subsequent exposures. This often happens when Spitzer observes relatively
bright stellar targets before or in between FIDEL AORs. We took the median
of all 24 micron exposures per AOR and compared them to one another in the time
order of their observing sequence. Time-varying latent images, typically at the
0.5% level, were apparent in some AORs. We produced masks to set affected pixels
to zero weight when combining the data into image mosaics.
Scan mirror delta-flatfields:
A median of all data show that the BCD frames have residual flatfielding artifacts
at the 1% level. These artifacts include some variability with scan mirror position,
suggesting that the pipeline spot-map corrections are not quite perfect. Additionally,
the default scan mirror position (CSM=2007.) shows large scale features (in the 70-prime
data only) which are not evident in either the other four scan mirror position
medians or in any of the 24-prime data from the epoch 1 ECDFS observations.
We created delta flats for each of the five scan mirror positions and divided these
into the data. For ECDFS epoch 1, this was done separately for the 24-prime and 70-prime images.
The frames affected by the latent artifacts are masked before creating the delta flats,
and all low-number data collection events (DCEs) visibly affected by the bias boost (see below)
are excluded from the delta-flat medianing. The corrections are applied to the unmasked frames,
including the low-number DCEs.
Remove cross-scan background gradient from low-number DCEs:
Bias boosts occur at the start of every sequence of data collection events
(DCEs) indicated by a unique EXPID number. We created median images
from all observations grouped by DCE number (DCENUM) to look for any residual
structure correlated with time since the bias boost. The first frame in each
sequence (DCENUM=0000) shows large-scale residual features after division by the
scan mirror delta-flatfields. While most of these features have disappeared
by DCENUM=0001, the mean background level of the low-number DCEs (with DCENUM approximately
less than 0010) remains depressed relative to the high-number DCEs (with DCENUM > 0015),
with a 0.2-0.3% gradient in the cross-scan direction across the chip.
These effects are more obvious in the shorter, 10-second 70-prime
frames, and tend to fade as the DCE number increases.
For the DCENUM=0000 frames, we used the median image as a tertiary flat-field
correction. In the 70-prime data, for 0001 <= DCENUM <= 0013, we fit a low-order
function along the row axis of the median images, and divided that shape into the
individual frames with DCENUM=0001 to 0013. For the 24-prime data from ECDFS epoch 1,
the individual DCEs have longer exposure times (30s instead of 10s), and these
DCE-dependent effects are greatly reduced. There, we applied corrections
only to the DCE=0000 and 0001 frames.
Remove AOR-to-AOR flatfield differences:
In some data sets, after the above steps were performed, large scale, low-level
patterns were still seen, varying from AOR to AOR. These were prominent in some
observations and not in others. We interpreted these as larger-scale latent image
patterns, which depend on the nature of targets imaged by MIPS prior to the FIDEL
observations. In order to remove
these, we constructed new median images of the dithered data within each AOR,
and then subtracted these from each individual image within that AOR.
For uniformity, we applied this step to all 24 micron data taken in 70-prime
mode, regardless of whether a clear residual pattern was seen.
This correction was only applied to the 70-um prime photometry-mode data;
the relative small number of independent dither points per AOR in the 24-prime
observations left us with insufficient spatial sampling to construct reliable
median images per AOR without effects of source contamination which might
subsequently affect photometry.
Jailbar patterns:
Low level jailbar patterns (vertical striping associated with small bias offsets in the
four interleaved readout amplifiers) could be seen in the DCE=0000 images. However,
these were effectively removed by the multiplicative corrections described above.
(The jailbar correction should probably be additive, not multiplicative, but the amplitude
is so small (0.1-0.2%) that this should have very little impact.) Residual jailbar patterns
were visible in only a small number of data sets, mainly those very strong cosmic ray hits.
These were discarded from the final combinations.
Sky subtraction:
Cosmic rays and bad pixels were masked in all frames during the MOPEX combination step
(see below). After a first pass run of MOPEX, these pixel defect masks were saved, and
then used to discard pixels when calculating a median sky background level (iteratively
sigma-clipped) for each individual science image. These median values were subtracted
from the data prior to (re)mosaicing.
3.2.3 Astrometry, image registration, and image combination
Image combination for the FIDEL MIPS 24 micron data was carried out using the
MOPEX
software (version 030106) provided by the Spitzer Science Center.
First, we created preliminary 24 micron mosaics for each AOR. MOPEX aligns the images
on the assumption that the world coordinate information in the BCD image headers, which
are generated based on telescope telemetry, are correct. Cosmic rays and other image defects
were rejected as outliers in the stack of repeated observations at a given sky position.
MOPEX generates masks of these outliers, which were checked to ensure reasonable behavior.
For each AOR-mosaic, we generated a catalog of 24 micron sources and matched this to
a catalog of IRAC source positions in the same fields. For the ECDFS, we matched the
MIPS data to a preliminary version (v1.0) of the IRAC data from
SIMPLE, a GO-2 Spitzer Legacy program
(PID 20708; PI: P. van Dokkum).
(The images and catalogs from
SIMPLE Legacy data release 1
are version 1.1, and thus somewhat updated from the ones used here for astrometric reference,
but should be largely consistent.)
External checks indicate that the SIMPLE astrometry
(which is tied to that from the MUSYC project)
agrees with that for the GOODS Spitzer and HST data within approx. 0.1 arcsec on average,
although there may be local residuals that are somewhat larger. For the EGS, we used
the GTO IRAC data from PID 8, as reduced and cataloged by the IRAC instrument team
(Barmby et al., in preparation). The EGS IRAC astrometry was tied to 2MASS.
We computed an iteratively sigma-clipped mean astrometric offset between the MIPS 24
micron positions and the IRAC positions. We also visually inspected
vector fields of the astrometric residuals looking for other systematic trends, and
found none of significance. The astrometric offsets were applied to the world coordinate
information (CRVAL1,2) in the headers of each image within that AOR. For this
version of the reduction, only simple shifts in RA and Dec were applied. The process
was repeated for each 24 micron AOR.
The astrometrically corrected images were then re-mosaiced, combining data from all AORs.
For the ECDFS epoch 1 observations, the 70-prime and 24-prime observations were combined
separately with MOPEX because they have different exposure times per image. However, the
same "fiducial image frame" was adopted for the output mosaics to ensure that they
would both be projected onto the same pixel grid. MOPEX produces "coverage maps"
showing the number of input images that contribute to a given pixel position
in the combined mosaic. We rescaled these to approximate exposure maps by multiplying
by the exposure time per DCE (10 and 30 seconds, respectively, for the 70-prime
and 24-prime data sets), and then combined the 70-prime and 24-prime sub-mosaics,
weighting by their respective exposure maps.
The final image mosaics were produced on a tangent plane projection, with a scale of
1.200 arcsec/pixel. For the ECDFS, we aligned the pixel axes with the J2000 celestial
coordinate axes. Due to the elongated geometry of the EGS, we chose to orient that final
mosaics
[CHECK AND DESCRIBE]
3.1.1 ECDFS and GOODS-N
3.2 MIPS 24 micron data reduction
3.1.1.1 BCD pipeline processing and filtering
3.1.2 EGS
3.2.1 BCD pipeline processing
The first FIDEL data release (DR2) consists of FITS images of MIPS observations of all three FIDEL survey fields. For each field, at each wavelength where we have data, we provide three FITS images: the science image itself, an exposure map, and an estimated noise image. We describe these in more detail here.
File names for these FIDEL data products include the following components, separated by underscores ("_"):
For item 3 (data set and epoch), we use the following notation: "p1" = photometry mode, epoch 1 (for GOODS-N in DR2), "p12" = photometry mode, combined epochs 1+2 (for ECDFS in DR2); "s1plus" = scanning mode, epoch 1, plus additional data, in this case, from GTO program PID 8 (for EGS in DR2). As an example, the FIDEL ECDFS 70 micron epoch 1+2 (photometry mode) version 0.50 science image is named "fidel_ecdfs_70_p12_v0.50_sci.fits". Similarly, the exposure map for the EGS 160 micron epoch 1 (scanning mode) plus GTO data are named "fidel_egs_160_s1plus_v0.5_sci.fits". The version numbers are based on FIDEL internal nomenclature, and have no particular significance, other than to indicate that these are best-effort preliminary releases (i.e., version < 1.0).
4.2 World coordinates
FIDEL image data products images use a tangent plane sky projection. The ECDFS
and GOODS-N images are aligned with the J2000 celestial axes, while the EGS images
are oriented at a different angle due to the elongated geometry of the field.
The pixel scales for the various images are given in Table 2.
Note that in the DR2 data products, the EGS pixel scale at 70 microns is different
than that for the ECDFS and GOODS-N, since the data reduction on different fields
was done independently. For a given field, the WCS tangent points (CRVAL1,2) of the
images at different wavelengths are generally different in the DR2 images.
Therefore, a transformation (beyond simple linear translation and resampling)
would be needed in order to achieve accurate pixel alignment from 24 to 70 microns.
However, the world coordinates of the two images should agree within the typical
measurement uncertainties for source positions.
4.3 Science images and flux units
The FIDEL DR2 science and standard deviation images have intensity units of MJy per
steradian, like the SSC BCD products. Because the pixel scales are different for
different images, so is the conversion from total data units integrated over a source
to the source flux density. The flux units are summarized in Table 2.
The last column of that table gives the multiplicative factor (FLUXZERO) that should be
used to convert summed counts within some aperture to a source flux density in milliJanskys,
i.e.,
These are computed using the pixel scales (also given in Table 2)
and standard calibration conversion factors (FLUXCONV) from instrumental units to MJy/sr
taken from the the MIPS Data Handbook
section 3.7.2 (see also
Gordon et al. 2007, PASP, in press).
The absolute uncertainties on the calibration factors are 4%, 7%, and 12% at 24, 70 and
160 microns, respectively.
No color-corrections have been applied to the flux values. The MIPS flux conversion
factors are calibrated for 10000K stellar spectral energy distributions. Galaxies, which
can have significantly different spectral energy distributions, may require a multiplicative
color correction term. This is discussed in
the MIPS Data Handbook
section 3.7.4 (version 3.2.1), where color correction factors are tabulated.
At 70 microns, typical color correction factors for galaxies are of order
1.07 to 1.09, depending on the shape of the SED. The correction factors are
generally smaller at 24 microns.
Pixels in areas where there are no data are set to zero.
[Note that the units for the FIDEL 24 micron science image data products are different
than those adopted for the GOODS 24 micron data reductions, e.g. for the GOODS-S field,
which is embedded within the ECDFS. The GOODS team converted the MIPS BCD data units back
to DN/sec.]
Due to the interpolation used when subsampling the MIPS pixels to produce the
mosaiced images, data values in adjacent pixels of the science images are strongly
correlated with one another. This correlation leads to an apparent suppression of
the background noise, effectively a local smoothing. Therefore (as in many astronomical
data sets), one should use caution when interpreting the measured RMS noise of the sky
background. The standard deviation images (see section 4.5) provide an
estimate of the local image noise, but one that should also be considered cautiously,
as discussed below.
4.4 Exposure maps
The exposure maps (*_exp.fits) represent the approximate total MIPS integration time in
seconds at each position on the sky in the co-added image mosaics. The MOPEX and DAT mosaicing
software produce "coverage" maps, which represent the number of individual exposures which contribute
to each pixel in the output image mosaic, and we have multiplied these by the approximate
mean exposure time per data collection event (DCE) to produce the exposure maps.
The precise exposure time per pixel is likely to be slightly different (probably smaller),
due to rejection of outlying values such as cosmic rays, array defects, etc.
4.5 Standard deviation images
We provide standard deviation maps (*_std.fits), which are an output product from the MOPEX
and DAT mosaicing software.
At each pixel position in the output mosaic, the standard deviation values are computed from the
RMS of the individual pixel values from images that contribute to that mosaic position,
divided by the square root of the number of exposures taken at that position. The units
of these images are the same as for the science images (see Table 2.
Regions of the images where there are no data are set to zero in the standard deviation images.
We caution that these standard deviation maps should be regarded as indicative only,
and regarded with some skepticism! They assume a certain noise model, namely, that
the shot noise for N exposures decreases as 1/sqrt(N), and that no other systematics contribute
to the image-to-image standard deviation that is measured. Although careful studies of
noise properties in MIPS data have shown that indeed the noise does reduce roughly as
1/sqrt(t) (see, e.g.,
Frayer et al. 2006b),
this scaling is not precise and in particular has not been validated for these particular
FIDEL data. The actual image noise that affects photometry may also have contributions
from source blending and confusion, which is not taken into account in these standard
deviation maps. Finally, sources can appear as "rings" of enhanced RMS in the maps,
primarily due to small variations in image alignment or due to pixel undersampling,
such that regions of strong image gradients (i.e., near the FWHM point of a point source)
lead to enhanced RMS.
Field Band
(micron) Pixel scale
(arcsec) Science data units
(BUNIT) mJy/data unit
(FLUXZERO)
ECDFS 24 1.200 MJy/sr 0.03385
ECDFS 70 4.000 MJy/sr 0.37607
GOODS-N 70 4.000 MJy/sr 0.37607
EGS 24 1.200 MJy/sr 0.03385
EGS 70 4.925 MJy/sr 0.57011
EGS 160 8.000 MJy/sr 1.50429 flux density (mJy) = FLUXZERO * data units