Recipe 27. MOPEX: MIPS 70 microns mosaic of the GFLS
We will demonstrate use of the software tool MOPEX to create a mosaic of 70 microns images obtained with MIPS for the Galactic First Look Survey. This mosaic can be compared to the mosaic produced with MOPEX as part of the standard data processing pipeline.
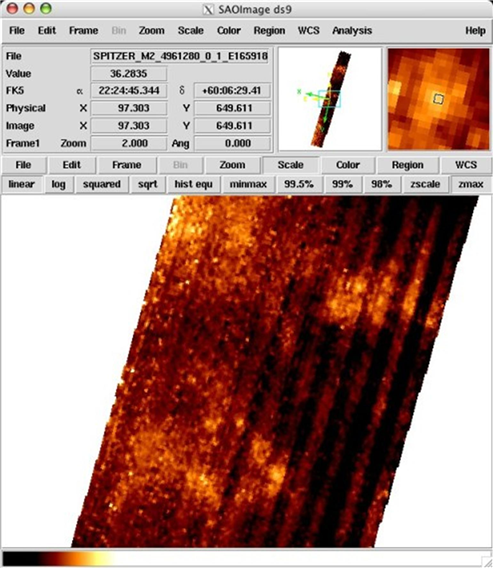
If you wish, you can examine the mosaic produced automatically by the data processing pipeline. This is the file r4961280/ch2/pbcd/SPITZER_M2_4961280_0_1_E165918_msaic.fits. You can use any FITS viewer to examine the mosaic image; an example using SAOIMAGE-DS9 is shown here (note that the mosaic covers a strip several degrees in length - only a small portion is seen in the magnified main viewing window):
27.2 Set up lists of filenames and namelist files in preparation to remosaic data
Obtain the appropriate namelist and pmask files to use with these data. The former is a parameter file for running MOPEX, while the latter is a mask of permanently bad pixels in the 70 microns array. These files are available on the SSC web site under MOPEX (http://irsa.ipac.caltech.edu/data/SPITZER/docs/dataanalysistools/tools/mopex/).
Use your favorite text editor to ensure that the value of the PMASK_FILE_NAME parameter in the namelist is set to mips70_pmask.fits.
To create the mosaic with MOPEX, we will use the Basic Calibrated Data (BCD) files located in r4961280/ch2/bcd/. The first step is to create input lists for the BCD files (*_bcd.fits), uncertainty images (*_bunc.fits), and mask files (*_bmask.fits). The input order for the BCD files does not matter, but the bunc and bmask files must be listed in the same order. Sample input lists are available on the Spitzer web site:
Store these files in the r4961280/ch2/bcd/ directory (along with the namelist and pmask files). Note that in order to streamline the data processing for the purposes of this demonstration, we have only included half of the available images in the sample input lists. If you wish, you may repeat the demontration using all of the available data.
27.3 Remosaic the data
We are now ready to run MOPEX. (Don't forget to source the MOPEX set-up file, mopex.csh.)
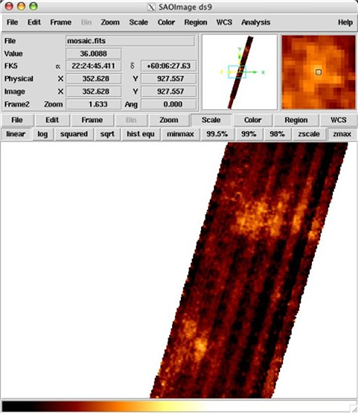
This will take several minutes to complete (e.g., about 15 minutes on a "standard" SunBlade 100). MOPEX creates a sub-directory called bcd_out/; the output image is located at bcd_out/Combine/mosaic.fits. Again, the mosaic image can be examined using your favorite FITS file viewer:
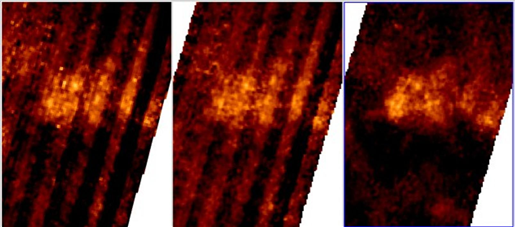
The "striping" of the mosaic image (which is visible in the output of both the automatic pipeline and MOPEX) is a data processing artifact caused by differences in detector response that are not removed by the pipeline at the BCD level. The striping in the GFLS data is particularly strong because the data were obtained prior to a bias change in the MIPS germanium arrays that was implemented specifically to address this artifact. This effect can be mitigated in the GFLS data by running MOPEX on the filtered BCD images (*_fbcd.fits) produced by the data processing pipeline, which are also located in the r4961280/ch2/bcd/ directory.
NOTE, however, that although the resultant mosaic will look better (see below), the filtering process renders the flux calibration of any extended emission in the image unreliable. Point source photometry should still be fine for targets fainter than 0.5 Jy at 70 microns (brighter targets will have some flux removed; i.e., they will actually be brighter than reported by photometry on the filtered mosaic image).
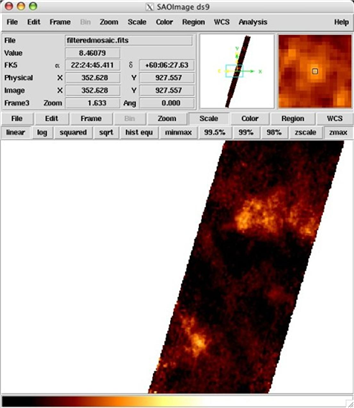
You can use the same input file lists for the bmask and bunc files, as well as the same namelist and pmask files, as were used for running MOPEX on the unfiltered BCD data. MOPEX creates a sub-directory called fbcd_out/; the output image is located at fbcd_out/Combine/mosaic.fits. Again, the mosaic image can be examined using your favorite FITS file viewer:
The following image shows a side-by-side comparison of the three mosaic images used in this demonstration: automatic data processing pipeline (left), MOPEX with unfiltered BCD data (middle), MOPEX with filtered BCD data (right). All three panels show the same region of sky at the same intensity scaling (keep in mind that only half of the available BCD data were processed with MOPEX in this demonstration, so the left panel shows slightly more sky - in the upper left corner - than the other two panels).