Recipe 2. Downloading Data from the Spitzer Heritage Archive - A Detailed Example
This section describes how to retrieve data from the Spitzer archive using the Spitzer Heritage Archive (SHA) web-based interface. In comparison to Recipe 1, it covers more about using the SHA tools to assess the observation to see if it meets your needs.
In this recipe, you will learn how to:
Download IRAC imaging data for CG4 using the SHA.
Use the SHA to search the Spitzer Archive for all possible and relevant CG4 observations.
Use the SHA to assess which observation will most quickly yield an image.
Select data for download, and do it.
2.1 Introduction and Terminology
The Spitzer Heritage Archive (SHA) is the permanent home for all of the data collected during the Spitzer mission, plus all the documentation you need to understand these data.
In this section, we will go over some terminology that you will need to know to use the SHA. For lots more information, please see the SHA online help, which can be accessed from the menu bar on top (SHA Help).
An individual Spitzer observation sequence is an Astronomical Observation Request (AOR). In certain cases (often calibration or sometimes science observations), you may also see an Instrument Engineering Request (IER). Either one involves many individual frames, as well as observer name, date of observation, object or area of the sky observed, and instrument used (IRAC, MIPS, or IRS)-- these are all part of the AOR. All of Spitzer's operations (planning, scheduling, processing) have been centered around these units (AORs or IERs).
Raw data that are fundamentally unprocessed are "Level 0" data. In general, most users need never worry about Level 0 data.
The individual data frames that emerge, calibrated, from the Spitzer pipeline are "Level 1," or "Basic Calibrated Data," or "BCDs." You can get just the BCDs from a region that you want, or you download the whole AOR.
The products that come from combining these individual data frames (such as mosaics) are "Level 2," or "post-BCD," or "PBCD data." These still exist fundamentally on an AOR level, e.g., you cannot get a Level 2 mosaic that is just a portion of an AOR.
You can also get higher level data through this interface. Such products are supplemental data that are produced either by the SSC or donated to us by professional astronomers, and represent additional processing. For example, a mosaic might combine data from 7 AORs into one big mosaic, with customized (as opposed to hands-off pipeline) processing of image artifacts. If you are familiar with the Legacy Enhanced Products, these are examples of such data. It used to be that you had to go through other interfaces to get to these products. Now, you can get to them via the "Enhanced Product" Search options, available as check-boxes for many of the searches. This search option will provide any additional data currently available via the IRSA/Gator tool for the region you have selected. For this example, however, there are no enhanced products of any sort available, so it does not matter if you select them or not. For an example of a search that does return results from these resources, please see the previous chapter.
All of the images come in single-plane FITS format. The other format for some data is IPAC table files (.tbl extension). IPAC table format is really just plain text, with a special header.
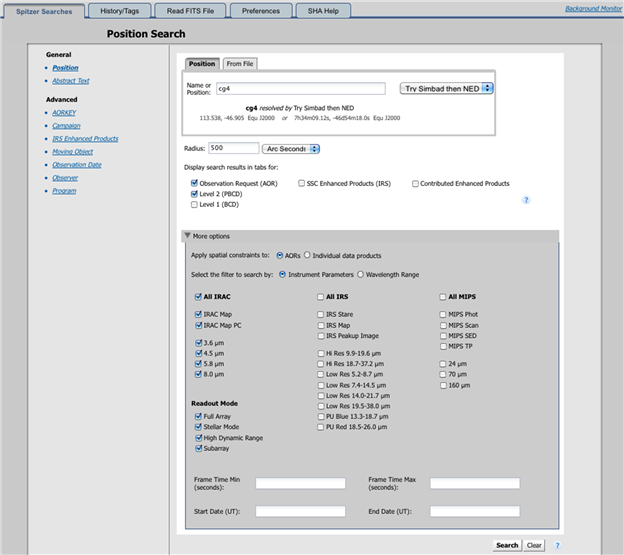
This first page is the search page for the SHA. It defaults to a Position Search. Help is available under the "SHA Help" button.
Step 2. Position search by name
You are dropped by default into a "position search." (There are other search options on the left.) Because the object we care about (CG4) is a Galactic, not an extra-galactic, object, SIMBAD (rather than NED) is a better name resolver. By default, it comes up with "Try NED first then SIMBAD" as the coordinate resolution option. If you just type in "CG4", and don�t change anything else, it will go to NED first, and find a galaxy by the name of CG4, at +31 degrees declination � you can see this under the "name or position" box, where the SHA resolves the name in real time. This is NOT what we want. Either before you type in "CG4" or even after you have done so, pick "Try SIMBAD first then NED" from the pulldown. It will then go and get the coordinates in real time, at the correct location, near �46 degrees declination. (Wanting to search for a whole bunch of targets? See the online help for more information on the file format.)
The default search radius is 500 arcseconds. That is fine for this example.
We want the AOR tab and the Level 2 tab to be returned, so we check off both of those, and leave "Level 1" unchecked. It does not matter if you check either of the Enhanced Products boxes � there are no data available in either enhanced product archive.
We would like to further restrict our search by instrument, so click on "More options."
We would like to apply the spatial constraints to the whole AOR, so we ensure that that radio button is checked, rather than "Individual data products."
We only want imaging data, so we can uncheck "All IRS", leaving just IRAC and MIPS. For the purposes of this example, we will also uncheck "MIPS", leaving just IRAC. If we happen to forget which wavelengths IRAC, IRS, and MIPS cover, we can also search by wavelength. And, we can also search by date of observation and frame time, if we want. For this example, it is fine to leave these blank.
THEN click "Search". This is what the relevant portion of the screen looks like right before clicking "Search":
Step 3. The Search results
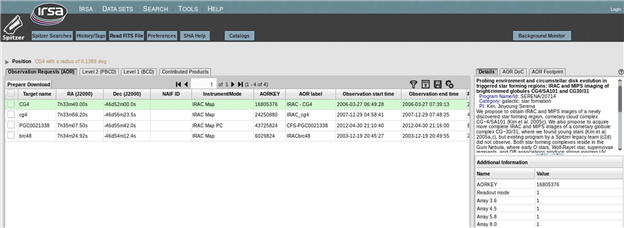
This is what we get for search results. Note that the search panel can be retrieved again at any time by clicking on the blue "Spitzer Searches" tab in the upper left.
Step 4. Understanding these results -- the AOR tab
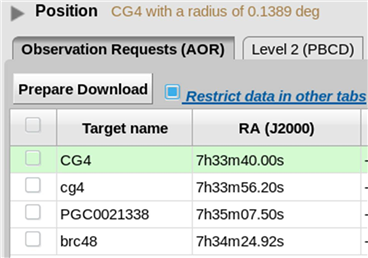
OK, so what does this all mean? It comes up by default with the AOR tab in front. This is the most succinct summary of the observations.
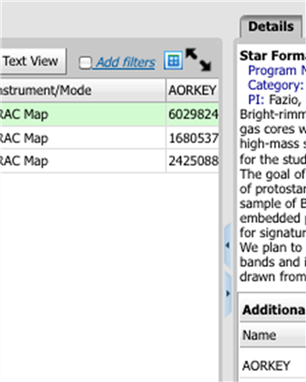
For CG4, there are four IRAC observations. On the screen (see figure above), you can see four lines. The columns (some of which you can see in the snapshot above) include target name (which can be cryptic; it was provided by the original observer), the RA/Dec, the NAIF ID (only applies to moving targets, which these are not), the instrument and mode, the AORKEY (a large integer that uniquely identifies the observation within the mission, sort of like a license plate identifies your car uniquely in your state -- some are just as readable), the AOR label (which can be cryptic; it was provided by the original observer), and the observation start/end date/time. On your screen, you can scroll right and see additional information, such as the program id, and the PI for the program. You can grab the slider that divides the two panes and drag it left or right to show more columns; it may or may not be obvious that more information is available at the top of the results pane. This figure shows the slider (blue left-right arrows in the bottom center-right of this figure) as well as the rest of the information from the top of the results window (top center-left, ending with the black arrows):
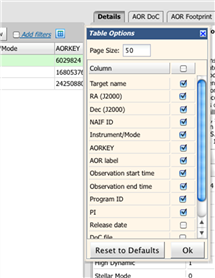
You can add additional columns or rows to the display. Click on the two wheels icon on the upper right of the search results pane to pull up a popup with a place to select which columns, and how many rows per page, to show.
In this case, for this example, the defaults are ok.
If you scroll over in your results window, you can find the observation start and end times. In this search, I have one observation taken in 2003, centered on a target called "brc48" (AORKEY 6029824), I have another observation taken in 2006, centered on a target called "CG4" (AORKEY 16805376), I have a third observation, taken in 2008, centered on a target called "cg4" (AORKEY 24250880), and I have a fourth observation, taken in 2012, centered on target called "PGC0021338" (AORKEY 43725824). If you scroll further right in your window, you will see the four PIs from the four different programs.
Other than that, how can you tell the difference between these four observations? Read on ...
Step 5. Understanding these results -- the Details panel and Visualization
Try clicking on each of the four lines in the AOR window. Note that the contents of the panel on the right, the "Details" pane, changes. The default "Details" tab within the pane gives you background information on the original program and observation parameters. These are important things, but peripheral to our task at hand, so for now, just satisfy yourself that you can see the contents change.
Now, click on the other tab in the Details pane, the "AOR footprint" tab. This is very useful, because it shows you the complete footprint of the AOR in question on a background image. The purpose of this is so that you can compare the region of sky covered by, say, four similar AORs, which is what we need to do here.
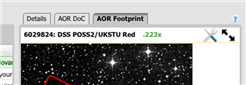
The SHA tries to choose background images intelligently, and generally it does ok. In this case, two of the AORs come up visualized on top of DSS images, and the other two (slightly larger ones) come up on IRAS images. You can see a brief description of the background image on the top of the image, under the tabs. It also has the AORKEY that is being visualized.
With any background image, if you move your mouse over the image, you will get a real-time readout of the position and flux density in a pop-up window.
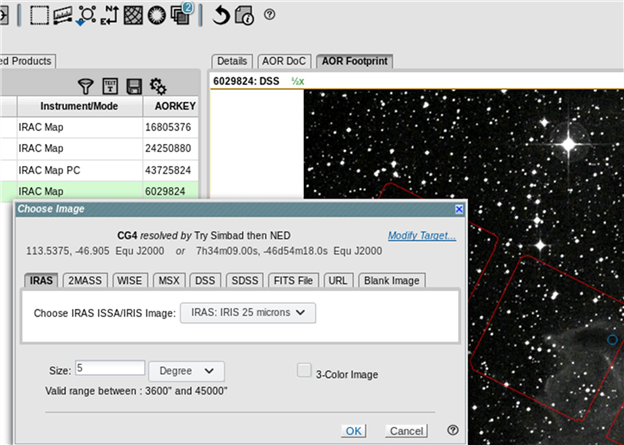
If you want to visualize one on top of a different image (wavelength, size, etc), you can change the background image. Let us change the visualization of the AORKEY 6029824 observation (on the DSS image) to be on an IRAS image. While this observation is highlighted in the list, and with the DSS image displayed under the footprint, move your mouse over the image.
Let your mouse hover on top of any of tool icons on the top pane just above the "Position" text. The tool tip will tell you more about what this icon does. Click on the icon showing a paper sheet with top left corner bent and a plus-sign near the lower right corner (2nd from the left). This enables you to change the background image. It produces a pop-up window. Check to be sure the target is right by checking that it has about the right coordinates. Pick an IRAS/ISSA image at 25 microns. Pick a 5 degree size. Here is what the relevant part of my screen looks like right before I clicked OK; note that you can create a 3-color image for the background if you wish:
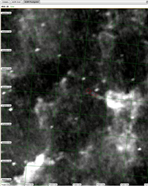
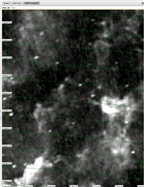
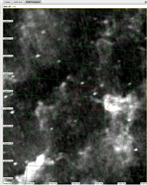
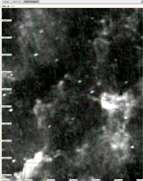
Here are the three footprints for the three IRAC AORs (obtained separately and screen-snapshotted here), with a coordinate grid overlaid for comparison (click on the grid-looking icon, about sixth from the right on the icon row, to add this to yours):
The first one, on the left, is the 2012 observation (AORKEY 43725824), the second one is the 2003 observation (AORKEY 6029824), the third one is the 2006 observation (AORKEY 16805376) and the fourth one is the 2007 observation (AORKEY 24250880).
So, we have already made significant progress! The footprints of the 2003 and 2012 observations are very much smaller than the other two observations. We do not want these small observations -- since they have less sky coverage, the chances of them containing a new YSO (our scientific goal for this analysis) are smaller than either of the other two observations.
Now, how can we pick between the other two observations? The one with irregular edges looks like it covers a larger area, so on the face of it, it seems like that is the best one to pick. BUT the fact that it has irregular edges betrays something about how the data were taken (which can also be seen in the Details tab under the observation configuration). And, it turns out, this has an effect on what mosaics are available. Read on!
Step 6. Understanding the results -- the Level 2 (PBCD) tab
OK, so now we know that we are not interested in the 2003 and 2012 observations (the ones with "brc" and "PGC" in the target and AOR names, the ones with Fazio and Tully as the PIs, AORKEYs 6029824 and 43725824). But we need to be able to pick between the other two observations. Let us do this by investigating which products are available.
In order to see what Level 2 (PBCD) products are available, check the boxes next to the 2006 and 2007 observations, and click on "Restrict data in other tabs."
What this does is filter the information displayed in the other tabs, e.g., "In the other tabs I have here, show me only the many files associated with these two AORs, not all four." By default, it shows you everything in the other tabs. Similarly, if, instead of two AORs, you want to see the files associated with just one of the AORs (say, the one from 2006), just leave that one AOR clicked.
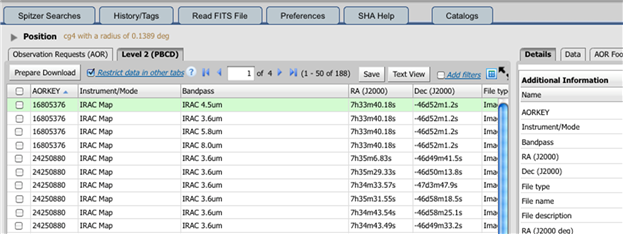
Then, click on the "Level 2 (PBCD)" tab.
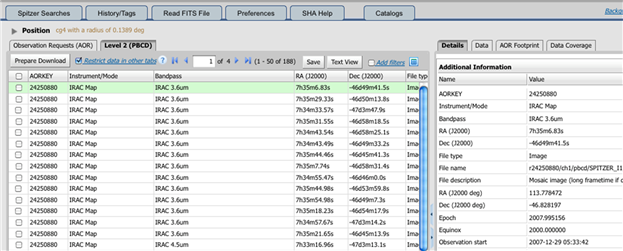
Note that there are a TON of lines here. From 2 AORs, we have gone to 188 lines (see the top center of the search results pane), and there will be more files that come with these data when you download them. That is why it is best to start with the AOR tab -- it's a higher-level summary of the observations.
OK, now it gets a little more complicated. For the most generic case, for most observations you will find in the SHA, you will get results like for the 2006 observation; the 2007 observation was taken in a different, rarer way. This is a good example, because it shows how to use the SHA to investigate the products. In all likelihood, your search of any given patch of sky will be simpler!
Look at the Level 2 (PBCD) results. The first text column is the AORKEY. Click on the AORKEY column label to sort by this column, in increasing order.
Look at how few files are listed for 16805376 (which is the 2006 observation), and how many for 24250880 (which is the 2007 observation). This is your first clue that maybe you want to use the data for the first one and not the second, even though it is covering a smaller area of sky.
The next column is the instrument and mode. These are all IRAC Mapping observations.
The next column is the bandpass. Look at the four files for 16805376 (which is the 2006 observation) -- there is one per bandpass. All the rest of the files in here (184-4 pages) are from 24250880. Ugh! To confirm that these are all images, look at the 6th text column � they are all images.
To see what the data look like, pick one of these (*maic.fits) files from 16805376 and go over to the "Details" panel. Click on the "Data" tab. That is the real mosaic that is shown there. You can scroll through the 4 mosaics (select different rows in the search results), and even rotate North up if you want (find the "rotate North up" icon). You can also still see some of the image artifacts that come from the bright stars that are incompletely removed!
Why are there so many more files for 24250880 rather than 16805376?
What is going on is that the data were taken in different ways. The observation from 2006 (AORKEY 16805376) is a simple map. As such, our pipelines understand exactly how to handle that and make a single mosaic for the whole observation. This is what you want to download for the lowest-energy solution. Proceed to the next step on downloading the data. The observation from 2007 (AORKEY 24250880) was taken using "cluster targets", which means that it covered an irregularly-shaped patch of sky where the observations were (among other things) designed to cover about the same area, regardless of spacecraft orientation. BUT, the Spitzer pipeline is a priori uncertain if these cluster targets are designed to cover one contiguous patch of sky, or many different tiny patches all over a 1.5 degree diameter circle. So, what the pipeline does is create one little mosaic for each pointing. If you want to create your own mosaic from the Level 1 (BCD) data, this distinction does not matter. If you are interested in a quick look of a complete mosaic, then you want the simplest solution. And, the SSC pipelines are pretty good � our pipeline mosaics are fairly nice, and may be sufficient for your science (see the corresponding Instrument Handbook for more information). For this example, take the low-energy solution and pick the simpler mosaic -- the observation from 2006 (AORKEY 16805376).
OK, go back and look at the Level 2 (PBCD) screen. Scroll right. You will see the long filenames for these observations. Note that the four files associated with AORKEY 16805376 all have that number in the filename itself, and that they are all listed as *maic.fits. This means that they are a MosAIC. You will get other files, such as uncertainties, when you download the data.
Step 7. Downloading the data
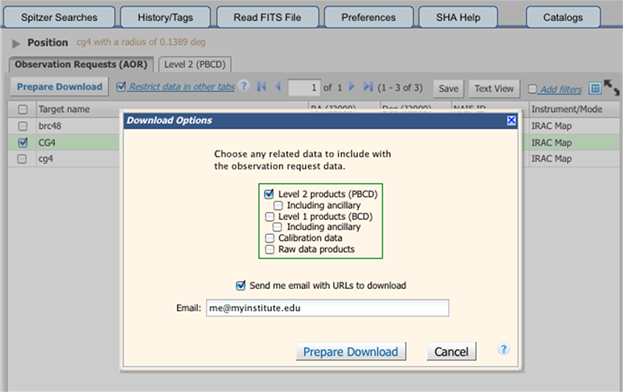
So, now we have picked the AOR from 2006, AORKEY 16805376. Go back to the AOR window, check just that AOR (uncheck both of the other AORs), and click on "Prepare Download" right above the column full of the check boxes. You get a popup asking what data you want to download. Pick the Level 2 products. If you want to be sure you have everything associated with this AOR, pick the ancillary data too.
Click on "prepare download." Enter an email if you want to be notified when the packaging is complete and it is ready for download
You get a new panel then, a "background monitor" which first looks like this in the upper right of your screen as it packages your data:
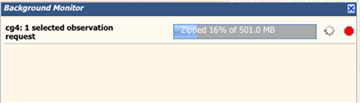
If you click on the link quickly, before it is done, you can see it package:
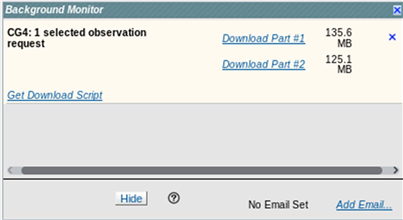
then like this when it is done, if you have not opened it:
and like this when you do open it:
Click on "Download now" in order to download your data.
The file will be a ".zip" file, and either your browser will be configured to ask you what you want to do with the file, or it may automatically unzip it and put the files somewhere you have configured (possibly a "Downloads" folder). This is entirely controlled locally by your browser, and each one is configurable and thus different on each computer. Find this file. You may need to search for "recently modified files" or something similar.
Step 8. Unpacking the data
If your computer did not by default unpack it, you will need to unzip the file. You can double-click, or from a Mac terminal window, type "unzip <blah>.zip" where <blah> means whatever the file is called. For this example, it was called "CG4-1-selected_AORs.zip".
For this example, we do "unzip CG4-1-selected_AORs.zip" from a terminal window, and this is what happens:
If you double-click to unzip, you may not get this readout, but all these files will (should) appear in whatever directory you have placed the zip file. Note that they are embedded within directories. These directories may seem arcane, and somewhat silly for these few files, but this directory structure makes a lot more sense when you have, say, 200+ files to download.
Step 9. What are all these files?
The files that you most likely care about the most are the *maic.fits files. These are the mosaic files. There is one per channel. The subdirectory "ch1" means the same as the "I1" in the filename -- it means IRAC channel 1, also known as IRAC-1, a.k.a. 3.6 microns. Same for ch2=I2=4.5 μm, ch3=I3=5.8 μm, and ch4=I4=8 μm. If you are trying to interpret these same sorts of search results for MIPS, MIPS-1=ch1=24 μm, MIPS-2=ch2=70 μm, MIPS-3=Ch3=160 μm. You may wish to move and rename these files straightaway into something more human-readable.
The other files are also coded by channel, but they are uncertainties ("munc", or Mosaic UNCertainties) and coverage ("mcov", or Mosaic COVerage). Coverage matters, because it tells you how many frames per position you have. The coverage map (and, more indirectly, the uncertainties) reflect how many times each tiny patch of sky was observed.
You have IRAC mosaics of the CG4 region! Now, try obtaining some MIPS-24 data for this region ....