|
Bandmerging Test Report
Lin Yan
July 30 , 2003 Version 1
The Bandmerger test report is here (PDF, 64 KB).
The 5 figures that go with the report are here.
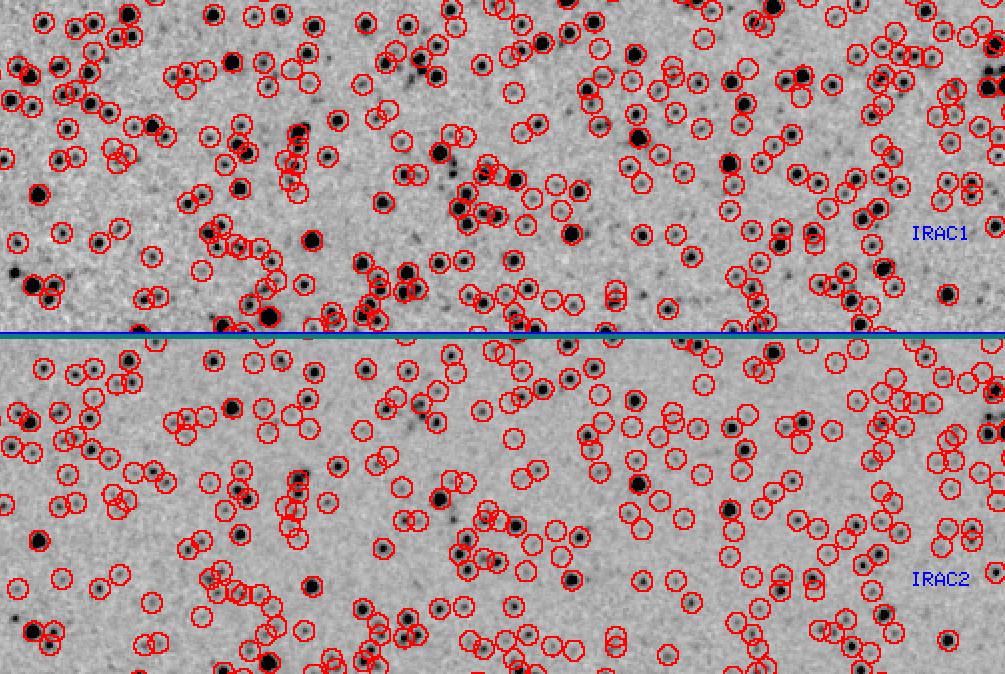
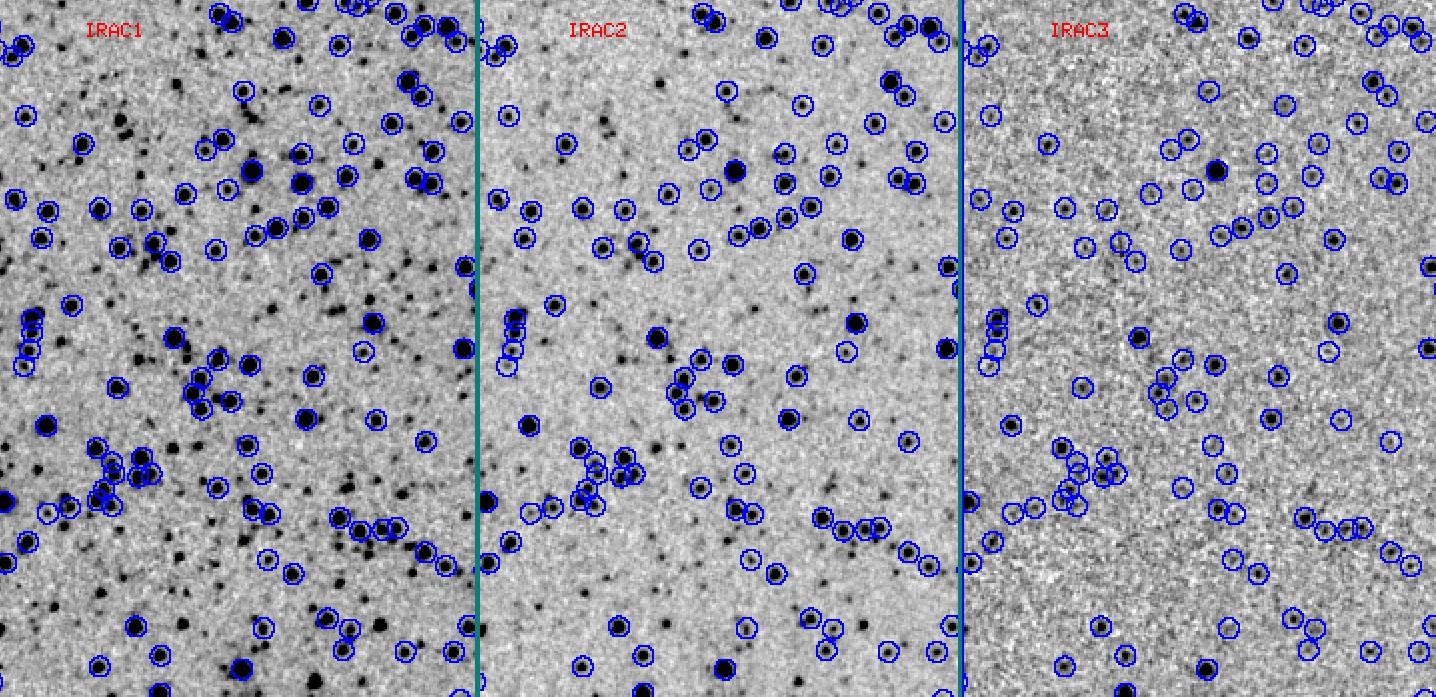
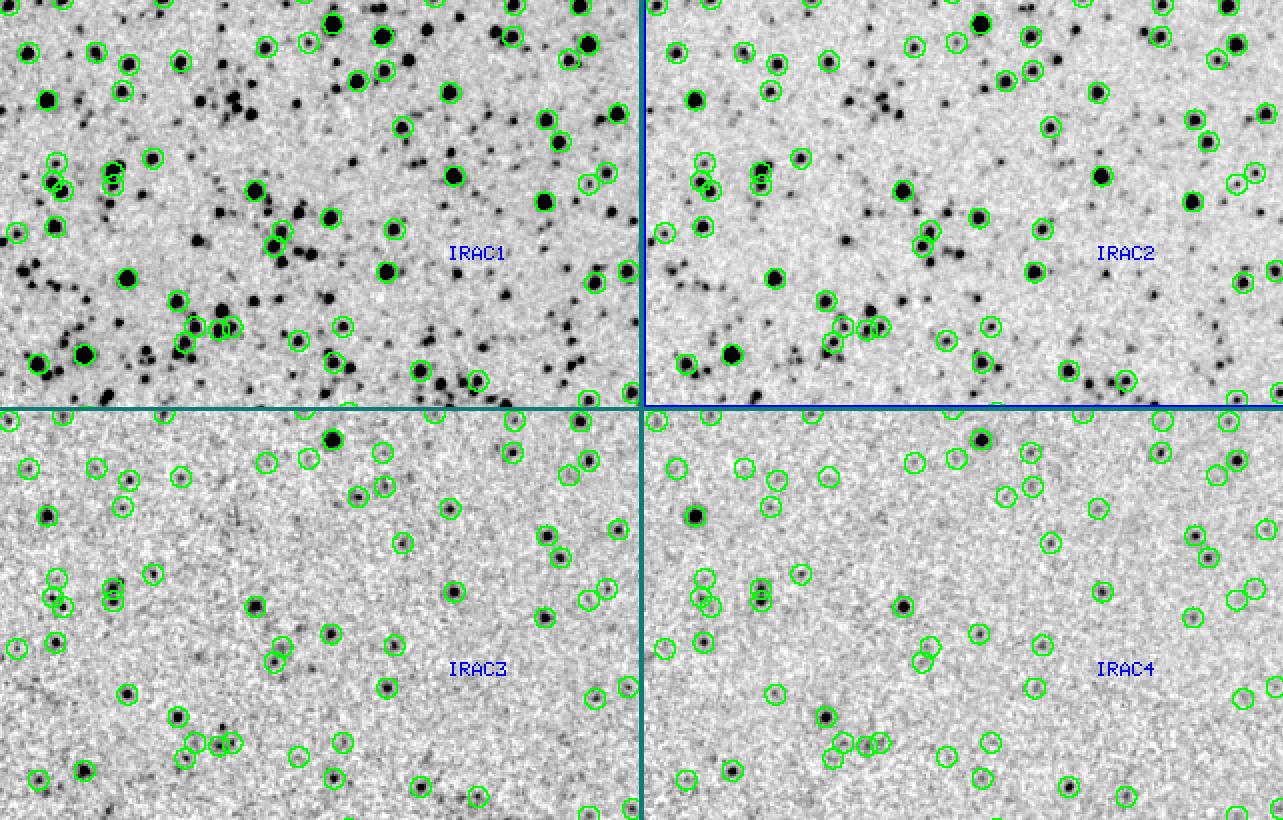
Figures 1-3 illustrate the results of bandmerging two bands (IRAC 1 and 2), three bands (IRAC 1, 2, and 3), and four bands.
Figure 1. Top and bottom panels show the small sections of IRAC channel 1 and channel 2 images, with the bandmerges sources marked in red circles. | |
Figure 2: in three panels shows the sections of the images of IRAC channel 1, 2, and 3, with the bandmerged sources marked in blue circles. It is obvious that many sources in Channel 1 are not detected in IRAC channel 3. | |
Figure 3: The green circles represent the sources detected in all four IRAC bands. | |
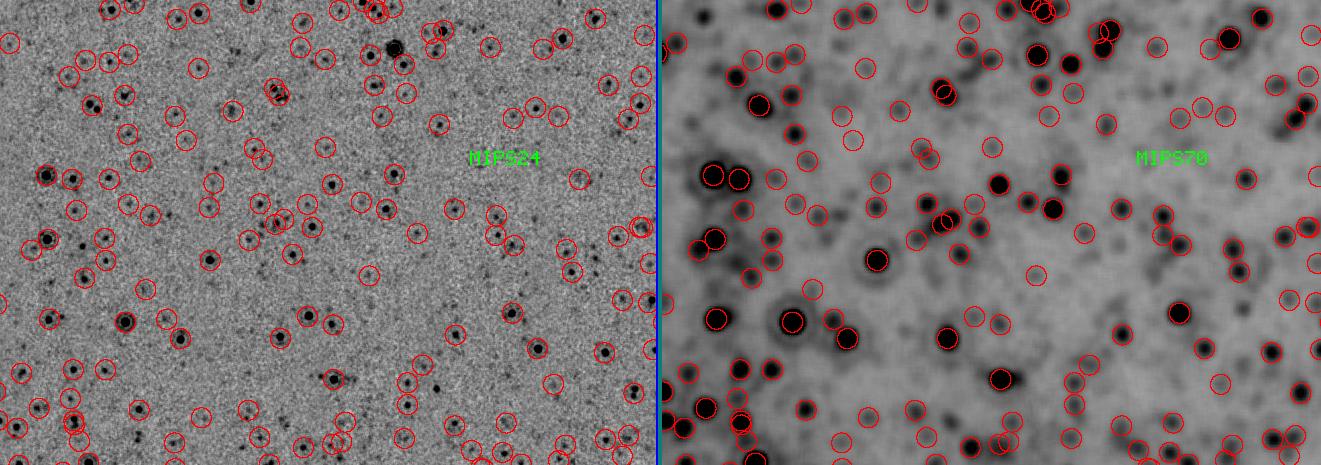
Figure 4: Bandmerging result between MIPS 24 and 70 microns. The MIPS 70 mosaiced image is resampled to the same pixel size, 1.225 arcseconds, as the mosaiced MIPS 24 micron image. The red circles mark the bandmerged source list. It is apparent that the MIPS 70 micron has a much larger beam and single large sources are resolved into multiple sources in the MIPS 24 micron band. | |
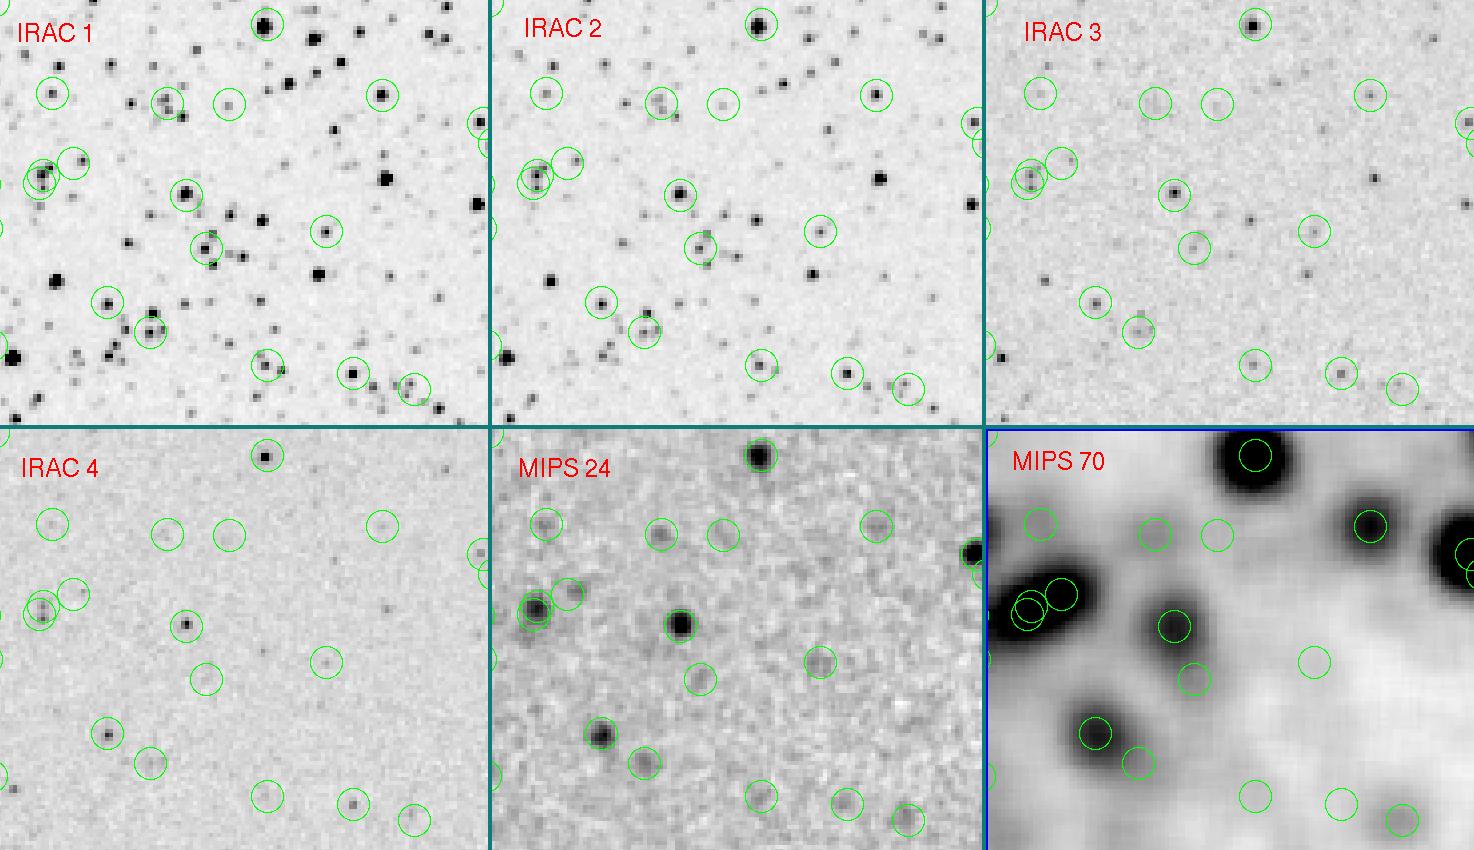
Figure 5: Shows in 6 panels the subsections of the images from the 6 bands, from IRAC 3.5 to MIPS 70 microns. Each panel is labeled with the name of the waveband. The green circles mark the sources found in all 6 bands as output by the SSC bandmerge module. |
|