|
WARM IRAC ONLY: Corrections for Intrapixel Sensitivity Variations ("the Pixel Phase Effect")
As in the cryogenic mission, there is a slight variation in flux depending on where a point source falls with respect to the center of a pixel ("pixel phase").
This so-called "pixel phase effect" is believed to be caused primarily by intra-pixel
quantum efficiency variations (e.g., see Mighell et al 2008; Download
PDF, 0.7 MB*).
Generally, the photometric response is higher near the center of a pixel and lower near the edge, although the behavior is not radially symmetric, and not centered exactly on the middle of a pixel. In addition, the shape of the correction varies somewhat from pixel to pixel across a given array. Near the beginning of the warm IRAC mission, we have analyzed data for the same standard star, NPM1p67.0536, placed on or near the nominal pointing center in both the full- and sub-array fields of view (FOVs). The star was observed using 0.4 second integrations alternately at 3.6 and 4.5 μm and mapping each pixel in 0.1 arcsecond steps. Each map was repeated 10 times for the full array and 4 times for the subarray observations to reach a signal-to-noise of better than 0.1% per 0.1 pixel step. In channel 1, the response varies by 7.4% across the pixel at full-array FOV center and 8.1% at the sub-array FOV center. In channel 2, the response varies by 3.4% at the full-array FOV center and 2.1% at the sub-array FOV center. This contrasts with a 4% variation in channel 1 and a <1% variation in channel 2 during the cryogenic mission. In addition to the maps for the center pixel
of each field of view, we produced an average map using a sparser
subpixel grid for a grid of pixels across the 3.6 and 4.5 μm arrays.
To generate the pixel-phase correction, for each BCD the star was centroided by calculating the flux-weighted first moments in x and y position using a five pixel wide square aperture and 7-9 pixel square background annulus. The flux was calculated using aperture photometry (aper.pro) and for a range of apertures. The correction is a weak function of aperture size as the intra-pixel variation mainly affects the flux contributed by the
central pixel of the aperture. The centroids were grouped into uniformly spaced bins in pixel-phase and the fluxes averaged for each bin to determine the relative flux for that bin. A "double Gaussian" function,
the sum of Gaussians in x and y phase, was the model used to fit the binned data.
IDL code to correct for the warm IRAC pixel phase effect (which includes the
variation with aperture size) may be downloaded here. An associated IDL centroiding code used when the pixel phase corrections were derived is also available. We typically used a 3 pixel box halfwidth (7x7 box) and a 6 pixel background border.
High-Precision Maps of the "Sweet Spot" Regions
The SSC has produced much higher fidelity versions of the
intra-pixel gain map for a sub-region (the "sweet spot") of the
center pixel on both CH1 and CH2 subarrays. These may be
downloaded
along with the associated
software to correct for the sweet spot sensitivity variations.
This high precision map is only useful when coupled with the
PCRS
peak-up
to ensure that a target arrives on the sweet spot.
We also include a list of reqkeys for the stellar observation sequences from which the pixel phase data were derived.
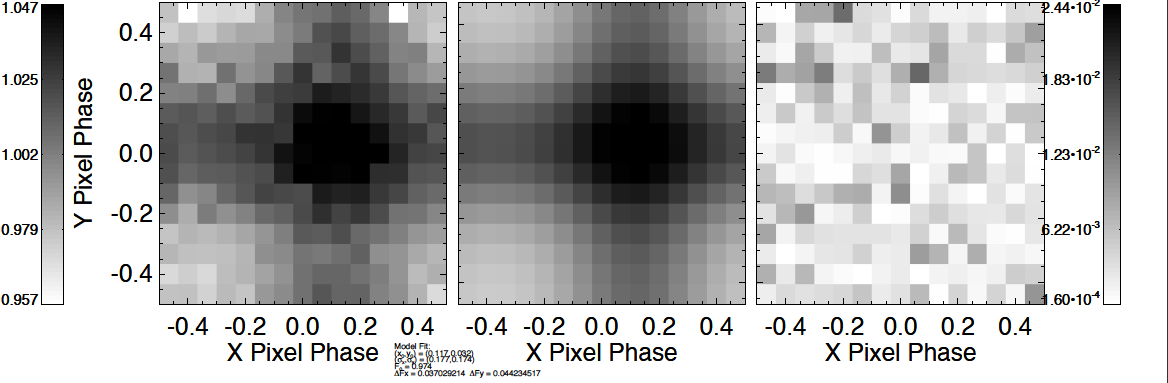
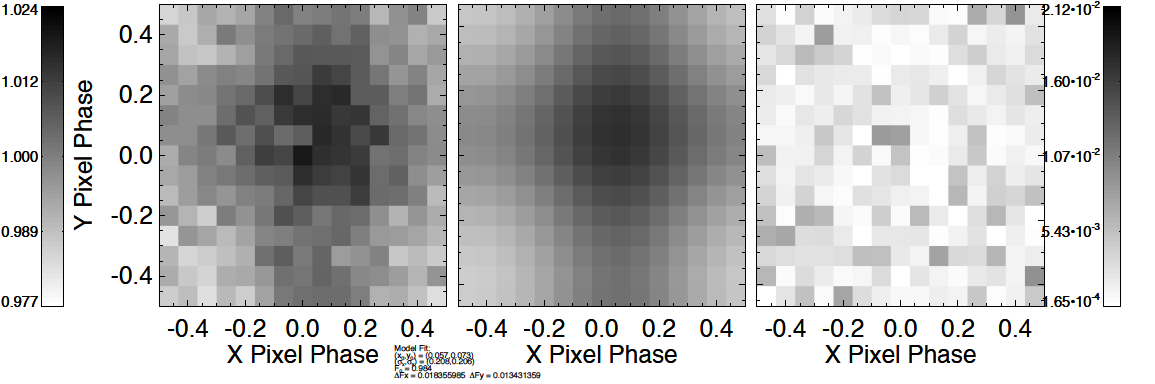
Pixel-phase maps, averaged over
a region surrounding the full array center, for 3.6 (top)
and 4.5 μm (bottom). The left hand panels display the
binned relative photometry, the middle panels the double
Gaussian fit and the right hand panels the residuals
from fitting the model to the data binned the same
way as the left hand panel.
* Copyright Society of Photo-Optical Instrumentation Engineers. One print or electronic copy may be made for personal use only. Systematic reproduction and distribution, duplication of any material in this paper for a fee or for commercial purposes, or modification of the content of the paper are prohibited.
|