|
Spectral Response
The IRAC system throughput and optical performance is governed by a combination of the system components, including the lenses, beamsplitters, filters, mirrors, and detectors. The system parameters are summarized in the Section 2.2.3 of the IRAC Instrument Handbook. The system response is based on measurements of the final in-flight system, including the beamsplitter, filter, ZnS & ZnSe coating transmissions, mirror reflectance, BaF2 and MgF2 coating transmissions, and detector quantum efficiency.
At each wavelength, the spectral response curve gives the number of electrons produced in the detector per incoming photon. While the curves provided are best estimates of the actual spectral response, it is recommended that the curves are used in a relative sense for color corrections and the SSC-supplied photometric scaling (implicit in BCDs and described in Reach et al. 2005, PASP, 117, 978) is used for absolute photometric calibration.
Previous to 26 September 2008, the provided spectral response curves were based on measurements of the optical components of IRAC as detailed in Stewart and Quijada (2000, Proc. SPIE 4131, 218) and prelaunch estimates of the telescope throughput and detector quantum efficiency.
The spectral response curves presented below reflect our current knowledge of the telescope throughput and detector quantum efficiency. The response curves use measurements of filter and beamsplitter transmissions over the range of angles of incidence corresponding to a distribution of incident angles across the fields of view of the IRAC detectors (Quijada et al. 2004, Proc. SPIE, 5487, 244).
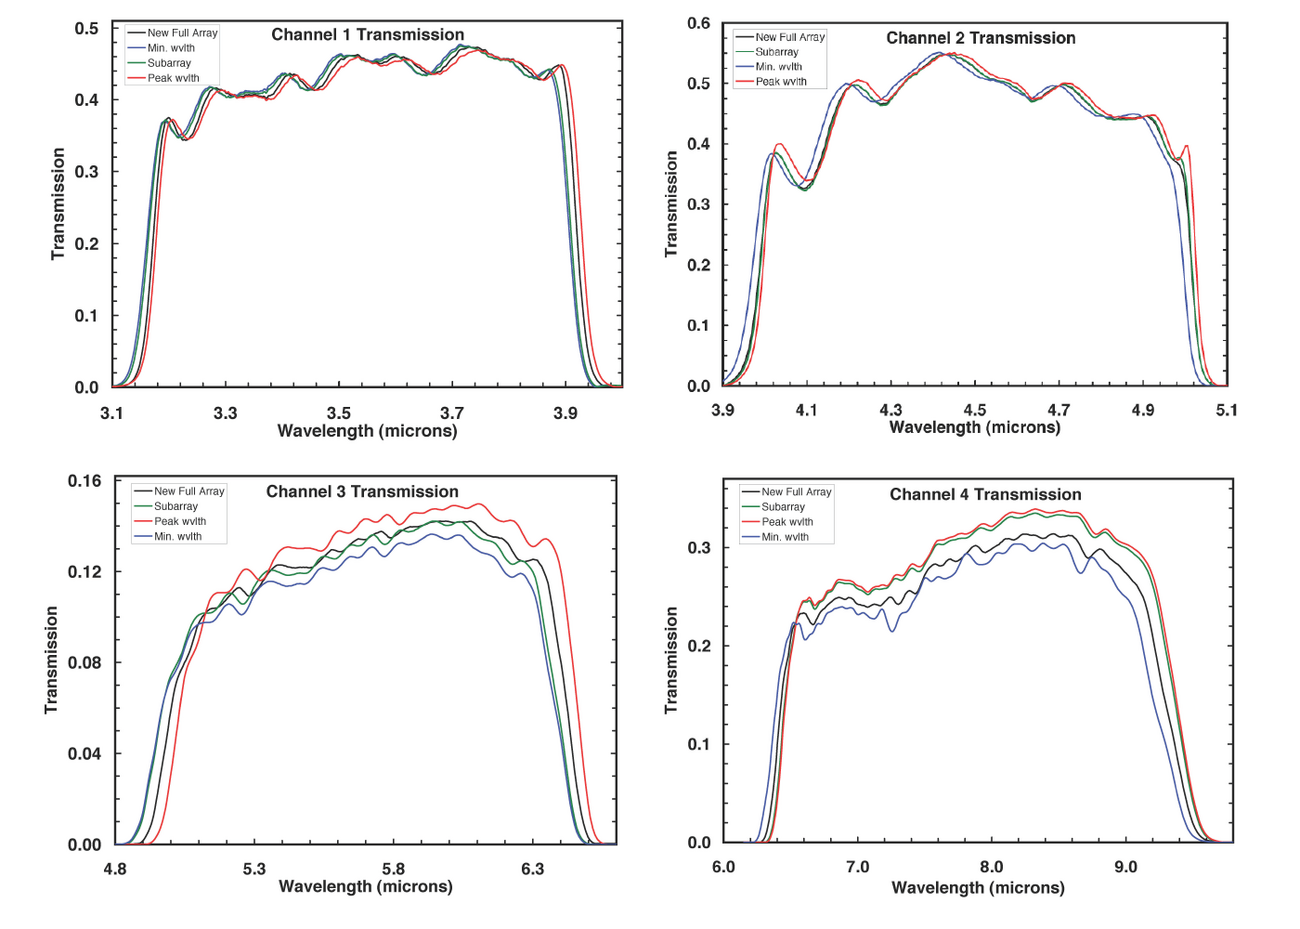
We provide three sets of curves for each IRAC channel: an average response curve for the entire array, an average curve for the subarray field of view and a data cube of the response curves on a per pixel basis. The average curves are useful for making color corrections to photometry of well dithered (4 or more) observations. The response cubes can be used for more rigorous color corrections on per instance basis. For most purposes, the average curves will be sufficient. A more detailed discussion of the spectral response curves is given by Hora et al. (2008, PASP, 120, 1233).
The following figures display the response curves for all 4 IRAC channels. The full array average curve is displayed in black. The subarray average curve is in green. The extrema of the full array per-pixel transmission curves are also shown for reference. Click on the figure for a higher resolution version.
The full array average spectral response curves for each IRAC band are here:
In each table, the first column gives the wavelength in microns. The second column gives the spectral response for unpolarized light.
The subarray average spectral response curves for each IRAC band are here:
In each table, the first column gives the wavelength in microns. The second column gives the spectral response for unpolarized light.
The per-pixel spectral response curves for each IRAC band are here:
Each file is a three-dimensional FITS cube. The first two axes are the x and y BCD pixel coordinates while the 3rd dimension is wavelength in microns. The wavelength per pixel mappings for the cubes are contained in these files:
For reference, the older response curves are here:
The old response curves contain some polarization information which may prove useful to some observers. In each table, the first column gives the wavelength in microns. The second column gives the spectral response for unpolarized light. The third and fourth columns give the spectral response curves separately for two orthogonal polarizations.
|