Pointing was controlled by Spitzer's Pointing Control System (PCS). This used a combination of a star tracker and gyros to locate and control the attitude of the spacecraft. Absolute pointing was controlled by the star tracker through a filter known as the “Observer” that smooths the raw star tracker output. Slews under the control of the Observer took ≈ 10 seconds to settle, so only the initial slew and cluster slews in celestial coordinates were carried out using the Observer. Once the observatory had taken the initial frame at the starting position, attitude control was handed over to the gyros. Mapping and dithering slews were made under gyro control with a shorter (≈ 5 seconds) settle time. The price to be paid for the shorter settle time was that the spacecraft attitude slowly drifted with respect to the Observer attitude, at a rate of ≈ 1 milliarcseconds/second. For long integrations (100 second frame time), attitude control was returned to the Observer after 80 seconds to halt the drift.
In addition, attitude resets were performed regularly (about every 30 minutes) to return the spacecraft attitude to the Observer attitude. The system was designed to ensure that any motion to return the spacecraft attitude to that of the Observer did not take place during an IRAC integration, to avoid smearing the images. Throughout the first 18 months of the mission, the PCS system and the corresponding parts of the IRAC AOT were being adjusted for optimal performance. The sections below serve as a guide to the astrometric accuracy and image quality that can be expected from a typical observation.
4.12.1 Pointing Accuracy
Slews under the PCS Observer control settled to the accuracy to which the star tracker-to-IRAC pointing offset is known, or about 0.5 arcseconds. Offsets between dithering/mapping moves were accurate to 0.1 arcseconds, relative to the commanded move, for small moves (≈ 10 arcseconds), and for large moves (≈ 0.5 degrees) the accuracy was ≈ 0.5 arcseconds (though this was improved as of spring 2005, and should be ≈ 0.2 arcseconds thereafter). An additional pointing error comes from the gyro drift which can accumulate over the 30-minute period between attitude resets. This error was typically ≈ 2 arcseconds for a worst-case frame just before a reset. The pointing uncertainties due to various effects are summarized in Table 4.9.
Table 4.9: Pointing uncertainties.
Pointing Effect
Characteristic Amplitude [arcseconds]
Characteristic Timescale
Accuracy
0.07
N/A
Wobble
0.07
40 min. or greater
Initial drift
0.5
≈ 30 minutes
Long-term drift
0.3
≈ one day
Low frequency jitter
0.07
≈ 2 minutes
High frequency jitter
0.03
< 0.02 seconds
Settling is the drift motion that occurs after the telescope slews to a new position. This took place typically with every IRAC frame at some level, unless REPEATS > 1. The settling drift rate decreased with time after the slew. The magnitude of the settling depended on the length of the slew, and it was expected to be the largest for the initial slew to the object, smaller for mapping slews, and the least amount of settling was expected for dithering offsets. There was also a steady drift of the pointing, ≈ 0.01 arcseconds/hour due to other changes in the star tracker to telescope alignment. The accumulated drift was removed using regular star tracker-to-telescope boresight calibrations every ≈ 12 hours.
The pointing of each frame as reported in the header keywords CRVAL1 and CRVAL2 was an average of the Observer attitude during the frame, and was typically accurate to ≈ 0.5 arcseconds (though it might be slightly worse for short frames where the Observer had not fully settled). Other header keywords related to pointing include RA_RQST and DEC_RQST, the requested R.A. and Dec. of the frame, and PTGDIFF, the difference between the requested and actual pointing. USEDBPHF should be T for all frames; if not, then pointing transfer had failed for the frame.
The Level 2 (post-BCD) pointing refinement module was run by default in the post-BCD pipeline to refine the pointing to 2MASS accuracy (≈ 0.15 arcseconds), and would be successful if there were a sufficient number of 2MASS stars in the data. The module operated by matching common stars between frames (“relative refinement”) and a fiducial set of stars from 2MASS (“absolute refinement”). The (R.A., Dec.) position and rotation of each frame was then adjusted until a global minimum in the residuals was found. Application of this to the Extragalactic IRAC First Look Survey (FLS) data resulted in a mean position error for high signal-to-noise stars with respect to 2MASS positions of 0.25 arcseconds.
The pointing refinement module wrote several new keywords to the header. The refined position is given by keywords RARFND and DECRFND, and rotation by CT2RFND. Note that the refined solution may be poor if the number of astrometry stars in the frame, NASTROM, was low (i.e., 0, or only a few stars). Pointing refinement works well for most channel 1 and 2 data, but short frames in fields near the Galactic poles in channels 3 and 4 frequently had too few stars for a good solution.
All the data had a superboresight pointing correction applied to the coordinates (see Section 5.3.2). Users wishing to make use of the superboresight solutions need to set USE_REFINED_POINTING = 0 in MOPEX, as the superboresight pointing is contained in the standard CRVAL1, CRVAL2, and CD matrix keywords (this is the recommended pointing to be used when making mosaics etc.). Data which have had this correction applied will also have the ORIG_RA, ORIG_DEC, and ORIGCD* keywords present which contain the initial (uncorrected) pointing estimate.
4.12.2 Target Acquisition Accuracy
Under normal conditions, Spitzer had a target acquisition accuracy of about 1 arcsecond. An additional option in the warm mission allowed users to choose an adaptive positioning technique (“peak-up”) available from the Spitzer Pointing Calibration Reference Sensor (PCRS) to enhance the accuracy and repeatability of target acquisition. For staring mode observations used in high precision photometry, PCRS peak-up (see Section 3.2) was crucial for positioning a target on the same portion of a designated pixel every time we pointed to it. This was vital for lessening the impact of correlated noise due to the intrapixel sensitivity effect (see Section 8.3). The PCRS operated in the visual part of the spectrum (505-595 nm) and its main function on Spitzer was to calibrate and remove the optical offset between the star trackers and the telescope. It could measure the centroids of stars in the 7.0 mag < V < 11.8 mag range to within 0.14 arcseconds (1σ radial) and feed these data, in the form of a pointing correction, to the spacecraft pointing control system (PCS). The PCRS was used frequently in the Spitzer cryogenic mission with the Infrared Spectrograph (IRS).
With IRAC the PCRS peak-up allowed us to repeatedly place a target within a quarter-pixel sweet spot on a designated pixel. When the Peak-Up target was the science target, it was found that more than 90% of visits were placed somewhere inside the sweet spot; 68% of visits were within 0.1 pixels of the center of the sweet spot; and repeat visits to the same target resulted in a spread of initial positions less than 0.06 pixels 68% of the time. This gave two advantages: (1) it minimized the offset in intrapixel sensitivity caused by the initial target acquisition; and (2) it allowed us to calibrate a smaller fraction of the designated pixel, with better fidelity. Furthermore, reacquisition peak-ups spaced approximately 10 - 12 hours throughout long staring observations minimized the effects of the long-term pointing drift (see below) by restoring the initial pointing location.
Target acquisition was statistically less accurate when the peak-up target was a different star than the science target (“guide star peak-up”). Although PCRS peak-up with a guide star (1σ accuracy better than 0.4 pixels, or 0.5 arcseconds) was still more accurate than blind pointing (1 arcsecond), only 40% (channel 1) and 61% (channel 2) of visits were placed within the sweet spot after a guide star peak-up. The accuracy of the guide star peak-up depended on the relative astrometric accuracy between the science target and the guide star, which partially explains the poorer targeting for the guide star peak-up compared to the self-peak-up. Another reason for this discrepancy may be an on-average larger slew offset between the PCRS and the IRAC FOV when the peak-up star was not the science target. It was found that repeat visits to the same target using the same peak-up star resulted in an RMS spread in the acquisition location worse than about 0.1 pixels 32% of the time. Most observations that used the guide star peak-up did not re-acquire their targets more than once every 20 - 24 hours, because peaking up more frequently would likely have taken a target further from the center of the sweet spot than the long-term drift (approximately 0.2 pixels over that timespan).
4.12.3 Pointing Glitches
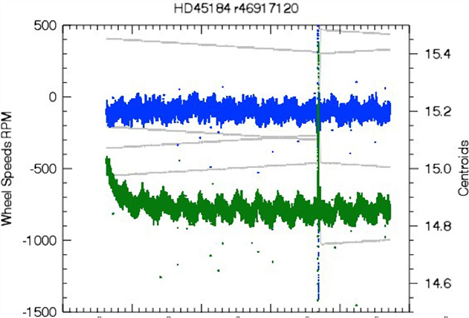
Instances of pointing glitches included cases in which a position jumps during an AOR, and then jumped back to the original position. These jumps were of order half a pixel in length (≈ 0.5 arcseconds), and are seconds in duration. They were not associated with a cosmic ray hit on the target because they lasted for more than a single frame. The jumps in position corresponded to reaction wheel speed shifts. Reaction wheel speed shifts were expected due to momentum rebalancing events in the wheel speed controller. The goal of this system was to avoid zero crossing disturbances (which would also induce position disturbances in the data) as long as possible. Autonomous momentum rebalancing only occurred when the system momentum grew above a certain threshold. Once this level was breached, the goal changed to balancing the reaction wheels so that it could stretch out the time until the next reaction wheel desaturation event. If the momentum fell back below that threshold, autonomous momentum rebalancing would once again be disabled. On average, only about one rebalancing per hour occurred. They mostly happened during slews, and therefore they were not expected to affect many IRAC images. They were most notable during staring mode observations (Figure 4.13).
Figure 4.13: Reaction wheel speed and centroid position as a function of time. Wheel speed changes are a few seconds in duration and this entire AOR is 11.5 hours in duration. This particular AOR shows a reaction wheel speed shift with a return to the original position. Grey lines correspond to the wheel speeds in RPM (left y-axis). Spitzer had four reaction wheels, and they all changed speed simultaneously about 75% of the way through this observation. Blue and green data correspond to the X and Y centroids of the target in the observation (right y-axis).
4.12.4 Jitter, Drift, and Wobble
Pointing jitter, drift, and wobble can cause broadening of the effective PSF in an image and an offset in the centroid of an object during an AOR. In this section, we define jitter as pointing motion on timescales of a few seconds or less, changing direction frequently, and typically affecting a single BCD image. We define drift as motion in a constant direction, and wobble as an oscillating motion, both of which occur on one minute or longer timescales, and therefore take place over many integrations in the AOR. Short-term drift usually dominates the first half hour of any given observation (although there is an underlying long-term drift during that time as well). We measure the magnitude of the long-term drift from the change in the position from 30 minutes after the beginning of the observation until the end of the observation. Long-term drift consists of a smooth change in the position of the target star over the entire duration of the observation, and is of order a few tenths of a pixel per day. See Section 4.12.4.2 for more details.
One manifestation of jitter and drift during integrations is that the measured target position in HDR short, medium (for 100 second HDR) and long frames is slightly different. These differences are usually ≈ 0.1 arcseconds, so they should not be a problem for most observers, but they are large enough to show up as residuals in difference images. Another manifestation of jitter and drift is the difference in positions between frames in staring mode observations (no dithering). This source of correlated noise is a significant source of error in high precision photometry.
4.12.4.1 Jitter
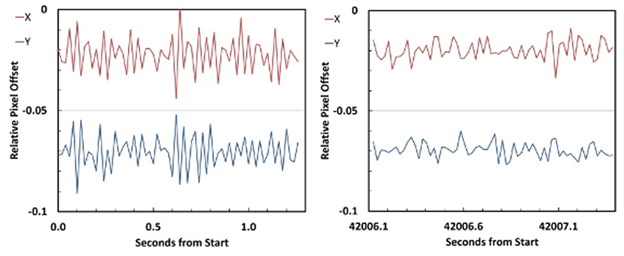
The jitter at short timescales was measured using the Galactic Center source at frame times of 0.02 seconds (50 Hz). The X and Y relative offsets of the source during these observations are shown in Figure 4.14. The jitter in these frames has a peak-to-peak amplitude of 0.04 pixel or less, and no discernable drift over periods of a couple of seconds. The jitter in the initial frames after the slew (left side of Figure 4.14) shows a higher variation, with a standard deviation of 0.01 pixels, and a peak-to-peak variation of ≈ 0.04 pixels. The frames at the end (right side of Figure 4.14) have a standard deviation of 0.004 pixels and a peak-to-peak variation of ≈ 0.02 pixels in each dimension. This could be due in part to settling motions after the slew (see Section 4.12.1).
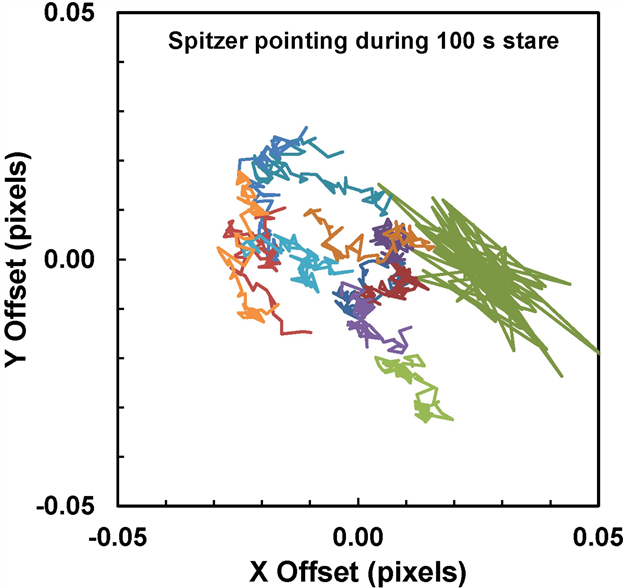
We can also examine the jitter during a longer exposure with less frequent sampling. The jitter during a 100 second period at the beginning of a long monitoring observation is shown in Figure 4.15. This plot is based on the 2013 Galactic Center data referenced above, taken in the IRAC subarray mode with a 0.1 second frame time. At the beginning of the dataset after the initial slew, pointing seems to be oscillating back and forth with an amplitude of 0.05 pixels peak-to-peak and at a centroid slightly offset from the rest of the data. The later data sets during the 100 second period seem to walk randomly around the field with small steps between each position.
Figure 4.14: Two 0.02 second frame time samples taken during a long staring observation. The total monitoring period was 42,007.38 seconds or 11.67 hours. The left panel shows the data at the very start of the stare after the initial slew to the object, and the right panel shows the jitter at the very end of the monitoring period.
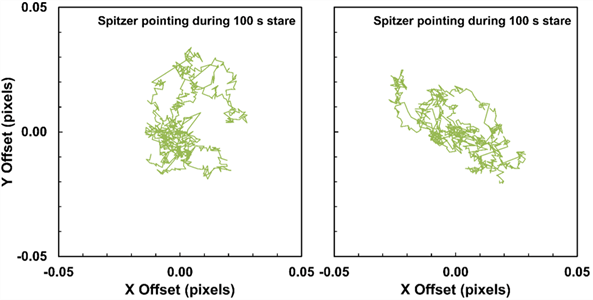
To illustrate the jitter behavior during a 100 second IRAC frame without an initial slew, Figure 4.16 shows two examples of the pointing motion during two 100 second periods of a long staring observation. These periods were during the middle of the observation, so they do not include any residual settling from the slew to this position. There was approximately a two second delay time between each set of the 64x0.1 second subarray frames, so that this dataset consists of a total of 770 frames of 0.1 second duration spread over the 100 second period. One can again see that the pointing seems to walk randomly over a region of ≈ 0.05 pixels in extent in both the X and Y directions. Sometimes it seems to dwell in one position for a longer time, and then at other times it moves at a more or less constant rate around the region near the pointing center.
Figure 4.15: Spitzer pointing during the first 100 seconds after a PCS offset to the object position. The plot shows the pointing during the first 12 subarray data sets using 0.1 second frame time (6.4 seconds per subarray set). The first set, plotted in darker green, shows up on the right side of the plot, offset from the other data sets, and showing back-and-forth oscillations of about 0.05 pixels peak-to-peak. The following data sets show a much-reduced motion in successive frames, with a random walk around the reference position.
Figure 4.16: Two examples of the drift during 100-second periods of a long staring observation. The pointing seems to walk randomly over a region of ≈ 0.05 pixels in extent, sometimes dwelling at a position for some length of time, and then moving on a path around the pointing center.
4.12.4.2 Drift
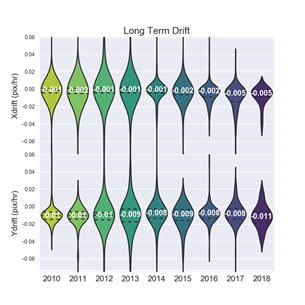
Long- and short-term drifts have different causes, and are discussed here separately. See also Krick et al. (2018) and Grillmair et. al. (2014) for more details. Long-term drift is caused by the way that differential velocity aberration corrections are handled by the spacecraft's Command and Data Handling computer (C&DH) and by the star trackers. Figure 4.17 shows the measured drift in both X and Y positions (top and bottom rows, respectively) as a function of time on the left, and pitch to earth-point on the right. Spitzer was required to point at Earth to downlink data using its low gain antenna. Pitch to earth-point changes throughout the mission as Spitzer moves further away from Earth and around the Sun in its Earth-trailing orbit. Note: pitch to earth-point is different from the pitch angle of any given observation. Because pitch to earth-point and time are correlated, it is hard to disentangle trends seen in these plots. However, since pitch to earth-point is a more physical variable describing a change in the telescope, as opposed to time, the IRAC team thought this is the most likely origin of the trends.
Figure 4.17: Distribution of long-term drift in both the X and Y directions as a function of time on the left and as a function of nearest in time downlink pitch angle on the right. These plots include all staring mode observations taken during the warm mission. Both plots are violin plots. Each violin-shaped object in the figure shows the median value and range for all the observations in that particular year (or at that particular pitch to earth point). Dashed lines show the median and inner quartiles of the distributions. The median values are printed at their locations. They can be thought of as smoothed histograms. Color variations between the violins have no meaning other than different years (pitches) have different colors.
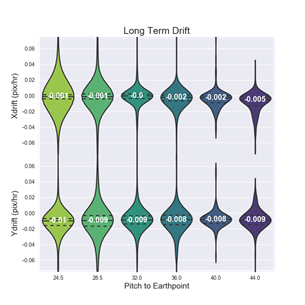
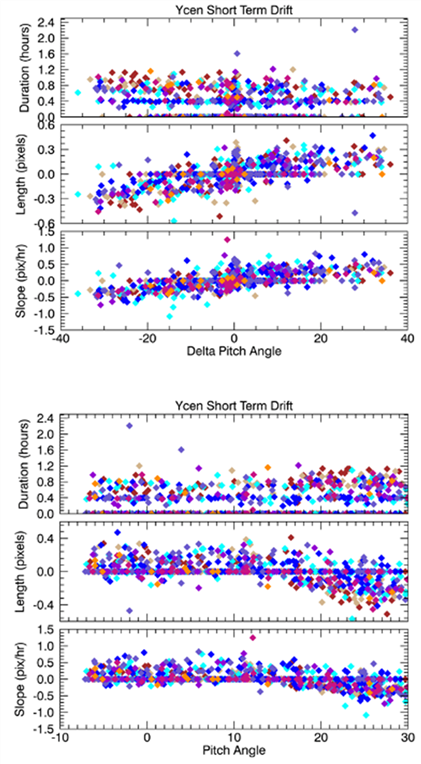
Short-term drift is the slow change in position over the first roughly half hour to two hours of a non-dithered observation. Figure 4.18 shows the Y centroid short-term drift as a function of pitch angle of the observation itself on the top and on the bottom as a function of change in pitch angle from the previous observation. Each plot has three panels: the top shows the duration of the short-term drift ranging from no drift to 2.4 hours with a median of around 0.5 hours. The middle panel is the total length of the drift in pixels, and the bottom panel shows the slope of the drift in pixels per hour. Points are color-coded by exposure time, for which we see no evidence of a correlation.
We do see evidence that both the scale and rate of the short-term drift are correlated with the pitch angle of the observation, and more strongly correlated with the change in the pitch angle from the previous observation. This implies that short-term drift is caused by a thermal settling of the telescope as it gets different illumination from the Sun through different pitch angles relative to the Sun, an idea first put forth by Grillmair et al. (2014). These correlations are likely not perfect because a) it is hard to measure the exact start and finish time of a drift superimposed on top of the other changes in the position of the centroids, and b) there is likely a correlation also with even earlier observations. The scale and rate of the short-term drift probably depend on the pitch angle and duration of several previous observations.
Figure 4.18: Short-term drift. Top: duration, length, and slope of the short-term drift as a function of the pitch angle of the observation itself. Bottom: same short-term drift parameters as a function of the change in the pitch angle from the previous to the current observation. Observations are color coded by exposure time, where shorter exposures are red and longer exposures are blue. The scale and rate of the short-term drift correlate with the pitch angle and the duration of several previous observations.
4.12.4.3 Wobble
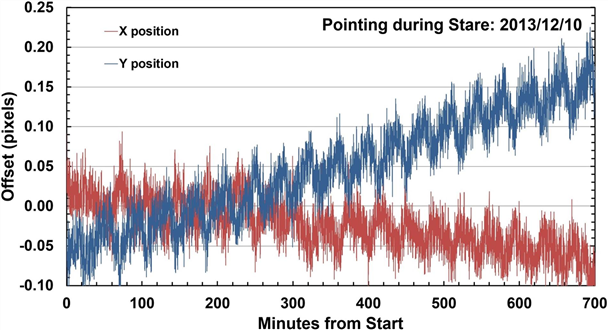
A slowly varying pointing oscillation is seen in many long staring observations. The oscillation is related to the spacecraft battery heating and cooling cycles that influence the mechanical link between the star tracker and the telescope, inducing a slight pointing wobble. The magnitude of the oscillation varies depending on the thermal state of the observatory and the recent pointing history. The characteristics of the oscillation have also changed over the warm mission. Prior to 2010 October 17, 07:25:00 UTC [1], the period was about one hour and the amplitude of the flux variation when staring at a star was ≈ 0.005%. The battery heater parameters were changed to reduce the temperature excursions from 1.0 K to 0.5 K. This reduced the period of the oscillation to ≈ 40 minutes, and the amplitude of the resulting relative flux variations to ≈ 0.002%. The offset variation of the short-term component after 2010 October 17 is ≈ 0.05 pixels (see Figure 4.19).
Figure 4.19: IRAC jitter observed during a long staring observation of the Galactic Center on 2013 December 10 (PID=10060). The X and Y offsets relative to the reference position are shown for both the X and Y directions on the IRAC array. Both directions show the oscillation (approximately 0.05 pixels) caused by the spacecraft heater, with about a 40-minute period. There is also an approximately linear drift in both dimensions over the length of the observation, larger in Y than in X.
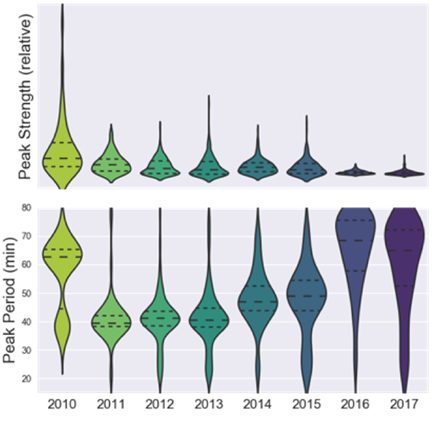
In subsequent years of the warm mission, due to the increasing pitch angle necessary to perform downlinks, the spacecraft began to drain the battery more during downlinks, requiring the battery to be recharged during science observations and calibrations. This use of the battery results in a higher operating temperature, and therefore, the battery heater came on less frequently and often was not operating during science observations. Therefore, the pointing oscillation was not present in some staring observations later in the warm mission. The history of the amplitude and strength of the battery heater oscillation over the 2010 – 2017 period of the warm mission is shown in Figure 4.20. The upper bound is not visible for 2016 and 2017, but it is symmetric with the lower bound. The exact size of the distribution is unimportant, but the important point is that we did not find a strong oscillation peak, reflected in the range of peaks that is very large. This large range means that the oscillations are non-existent, as can also be seen by the dramatic decrease in the strength of the in 2016 and 2017.
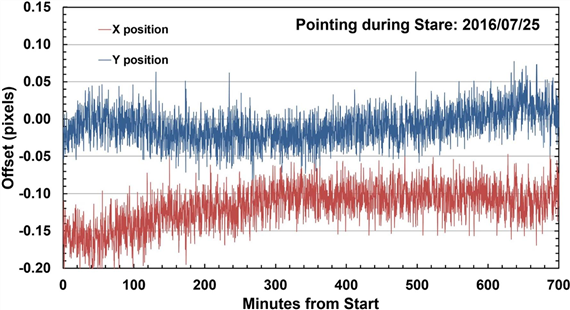
An example of a long stare without the oscillation is shown in Figure 4.21. These are observations of the Galactic Center in 2016 July, performed in the same way as the dataset shown in Figure 4.19. However, the battery heater was apparently not operating during this period, so no periodic oscillation is seen in the pointing. These data also show much lower long-term drift.
Figure 4.20: Amplitude and strength of the battery heater oscillation over the 2010 – 2017 period of the warm mission. Both plots are violin plots. Each violin shaped object in the figure shows the median value and range for all the observations in that particular year. Dashed lines show the median and inner quartiles of the distributions. Color variations between violins have no meaning other than different years have different colors.
Figure 4.21: IRAC pointing variations observed during a long staring observation on 2016 July 25 (PID=12034). This observation was similar to that in Figure 4.19, but here we do not see the spacecraft heater oscillation.