The true median dark currents, due to nonzero leakage resistance or recombination in reverse-biased detector diodes, are very small compared to the current from the background at the darkest part of the celestial sphere. Labdarks (addressed in Section 5.1.10) were only available in the cryogenic data pipeline. They were measured with the cold IRAC shutter closed, and with zero incoming photon flux. Skydarks (addressed in Section 5.1.15) have pixel values that differ from zero, with significant pixel-dependent offsets. These offsets are usually positive and depend on the frame time and the Fowler number, as well as on the history of readouts and array idling over the previous several hours. Channel 3 is by far the most extreme case, in which, for example, a 100 second (Fowler-16) frame can be offset as much as 370 DN (median), or the equivalent of 1400 electrons at the integrating node, with no light incident on the array. The signal from the darkest background in a 100 second frame in channel 3 is only about 1000 electrons. Channel 1 has much smaller offsets, but the sky is so dark that the offsets are often larger than the background signal. Channel 2 has very small offsets, which are less than the background signal except in short frames or certain frames immediately following a change in integration time. The background in channel 4 is so large that the offsets are almost negligible except in very short integrations. There is no measurable excess noise from the offset itself: the noise is not the square root of the equivalent number of charge quanta on the integrating node. This is because the offset arises from the redistribution of charge within the mux in which the associated currents and capacitance are much greater than in the detector diodes. However, imperfect correction of this “first-frame” effect (see also Section 5.1.10) does increase the uncertainties in the BCD frames. The uncertainty scales with the size of the offset and its small-scale spatial nonuniformity. Only in channel 3 does it significantly increase the total pixel noise.
We can break down the offset into contributions beginning with the largest spatial scale down to the smallest. In this view, the largest part of the offset is uniform over the array, followed by the contribution of a few spatial gradients, and some pinstriping that repeats every four columns (due to the four array outputs), with a few columns with odd offsets (due to hot pixels or parts of the mux), and weakest of all, pixel-to-pixel dependent offsets.
There are some very obvious features imposed on the true offset, due to a relatively small number of hot pixels, and mux glow. Hot pixels usually appear bright, and in such cases one can see a trail of muxbleed (in raw images) or a pinstripe pattern in channel 1 and 2 arrays, or the bandwidth effect (in channel 3 and 4 arrays) following the hot pixel. These pixels have high dark currents and are usually isolated, but sometimes in a clump. “Dead” pixels are really just very hot pixels, so hot that they saturate before the first pedestal sample. In a BCD image, hot pixels do not appear bright because they have been canceled by the labdark (cryogenic data) or skydark (both cryogenic and warm missions) subtraction. Most hot pixels appeared after the launch and are the result of hits by energetic nuclei. By annealing the arrays during the cryogenic mission, we restored most pixels that got activated. Some of them could not be restored, and thus they became permanent hot pixels. Some pixels jumped randomly from normal to high dark current and back, dwelling in one state for anywhere from a few minutes to weeks, so they may not be canceled by a skydark subtraction. These are IRAC's “rogue pixels.” The IRAC “static” bad pixel masks were updated when significant changes in the permanent bad and/or hot pixels occurred.
Areas of mux glow are visible in the labdark and images. Electrons and holes recombine in diodes in the mux, allowing current to flow. Photons emitted in the recombination are detected in the InSb or Si:As detector above or near the source of the glow. Most prominent is the glow from the four output Field-Effect Transistors (FETs) visible only in Channels 3 and 4 (the Si:As arrays). These are semicircular areas about 17 pixels in radius located near column 256, row 30 at the right edge of the images. The glow is most obvious in long frames. Another glow region is visible along the last few rows in all four channels; it comes from the unit cell FETs. Currents flow through all the unit cell FETs in the last row which is left selected during the integration, so the glow is particularly bright in the last row itself. The third and faintest glow region is along the left edge (column 1) of channel 3. Detected glows have shot noise, which can exceed the background noise along the last row and in the brightest parts of the semicircular areas. Pixels are masked in these areas where the noise significantly degrades sensitivity in 100 second frames.
Table 7.1: Definition of bits in the pmask. The pipeline used all the bits.
Bit
Condition
0
Not set
1
Not set
2
Not set
3
Not set
4
Not set
5
Not set
6
Not set
7
Dark current highly variable
8
Response to light highly variable
9
Pixel response to light is too high (unacceptably fast saturation)
10
Pixel dark current is too excessive
11
Not set
12
Not set
13
Not set
14
Pixel response to light is too low (pixel is dead)
15
[reserved: sign bit]
7.1.1 Bad Pixels
Included with the BCD data are three masks, a semi-static mask (the “pmask”; available in the cal/ directory after downloading all the data for an AOR) that contains permanent or semi-permanent bad pixels and regions, and which is the same for all the BCDs in a given AOR and channel, the “imask” that contains bad pixels specific to any one BCD, and the “rmask” that contains outliers masked by the post-BCD pipeline. All of the bits set in the imask indicate pixels that have been compromised in some fashion. Not all of the imask bits are set by the BCD pipeline, but some bits are placeholders for post-BCD processing of data artifacts. The higher the order of a bit set in the imask, the more severe the effect on data quality. Mask values are set as powers of two, and summed together for each pixel. Any pixel with a bit set in the pmask is suspect.
Several sets of pmasks have been produced. At the start of the mission, sets were produced at 3 - 6 month intervals. As the bad pixel behavior has been shown to vary little with time, these intervals were extended to 12 - 18 months. The masks are made from calibration data spanning (at least) three campaigns, allowing some short-term bad pixels to anneal out, while retaining the ones persistent on timescales of weeks or more. Pixels consistently noisy in the darks or flats in these three (or more) campaign sets are flagged. The regions of amplifier glow are also flagged (with bit 10). Combined masks are also available, with only bit 0 set to indicate a suspect pixel. The “OR” masks contain all the pixels that have been flagged in any pmask set during the mission, and the “AND” masks contain only those pixels set in every pmask set. Table 7.1 and Table 7.2 show the corresponding definitions for each bit value. The DCE Status Mask Fatal Bit Pattern = 32520 (bits 3, 8 - 14; to be used with the MOPEX software).
Table 7.2: Definition of bits in the “imask.” The pipeline used bits 3 and 8-14.
Bit
Condition
0
reserved for boolean mask (or if best practice bits set, data quality)
1
reserved for future use
2
optical ghost flag (set by post-BCD tool)
3
stray light flag (set by post-BCD tool)
4
saturation corrected in pipeline
5
muxbleed flag in channels 1,2; bandwidth effect in channels 3,4 (set by post-BCD tool)
6
banding flag (set by post-BCD tool)
7
column pull-down flag in channels 1,2; vertical banding flag in channels 3,4 (set by post-BCD tool)
8
crosstalk flag
9
radhit (single frame radhit detection)
10
residual image flag (not functional in IER observations)
11
not flat-field corrected
12
data not very linear
13
saturated (not corrected in pipeline), or predicted to be saturated in long HDR frames
14
data bad and/or missing
15
[reserved: sign bit]
7.1.2 Flat-field
IRAC superskyflats are shown in Figure 4.4 (see also Section 5.1.16). The y-axis in the 3.6 and 4.5 μm flat images is flipped with respect to (C)BCDs. For the cryogenic mission these were made by combining the flat-fields from the first five years of operations and for the warm mission the superskyflats were made by combining the flat-fields from the first five years of warm mission. The dark spot in channel 4, near the left side and about half way up, and the dark spot in about the same place in channel 2, are due to the same speck of contamination on the channel 2/4 pickoff mirror. The darkest pixels in the spot are 20% below the surrounding area in channel 2, and 32% in channel 4. Flat-fielding in the pipeline fully corrects for these dark spots in the data. These flats are extremely low-noise, with stochastic pixel-to-pixel uncertainties of 0.14% (0.17%), 0.09% (0.09%), 0.07%, and 0.01% in channels 1 through 4, respectively, where the values in parentheses refer to the warm mission. This is smaller in amplitude than the intrinsic pixel-to-pixel scatter in the gain. Furthermore, because the superskyflats are derived from data over many parts of the sky, with many dithers and rotations of the telescope, they are substantially free of errors arising from gradients in the zodiacal background, or from residual contamination by stars and galaxies. All the IRAC data were reduced with the same set of superskyflats (cryogenic or warm).
Large-scale gradients corrected by the flats are on the order of 10% - 15%. Systematic errors in the flats are due to the gradient in the zodiacal background and straylight removal errors. The former is expected to be very small based on results from other missions, e.g., ISOCAM 25 µm (Ábrahám et al. 1997). Diffuse stray light is a significant contaminant in the raw images at the ≈ 5% - 10% level. This diffuse light looks like a “butterfly” across the top of the InSb detectors in channels 1 and 2, or a “tic-tac-toe” pattern in channels 3 and 4. It is always present, resulting from the scattering of the zodiacal background onto the detectors. In both the skyflats and the science data, a model of the stray light has been subtracted, but this leaves a residual pattern on the order of 1% that contaminates the flats. These errors are substantially ameliorated by dithering (errors will decrease as, where N is the number of dithers, and will quickly become very small relative to other uncertainties).
The left edges of channels 1 and 3 are vignetted due to a misalignment of the IRAC optics with the telescope. The darkest pixels have 50% of the mean throughput in channel 1, and 70% in channel 3. The vignetting only extends for 10 - 15 pixels. The vignetting is compensated for by the flat-fielding, and results primarily in an increase by at most of the noise in the affected pixels.
Finally, one should note that the flat-fields are generated from a diffuse, extremely red emission source. While the resulting flats perfectly flatten the zodiacal background, they are not accurate for compact objects with different spectral slopes, the most obvious examples being stars. Please see the section on array location-dependent corrections (Section 4.5).
7.1.3 Missing Data
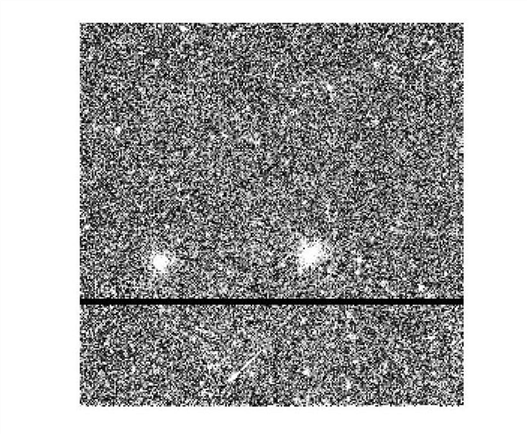
In some cases, there may be sections of data that are missing. These are usually marked in both the raw and the (C)BCD data headers in the header keywords MISSDATA = T (both full array and subarray data) and MSLC1 (start of gap; raw only), NMSD1 (number of missing lines, raw only), MISS_LCT (total missed line count in the current FITS file; raw only), and MANCPKT = T (if ancillary data are missing; raw only). An example of missing full array data in a CBCD is shown in Figure 7.1. The subarray data are stored in blocks of four rows of 256 pixels, and missing frames may, for example, make an object completely disappear in a subframe. The corresponding mask image should show a flag revealing that the data are bad, and the header keywords should also indicate a missing line problem.
Figure 7.1: Full array CBCD image showing rows of missing data (dark band across the image). This observation is in channel 2, 12 second HDR frame, PID=80254, AORKEY 44050944.