The IRAC detector arrays were developed by the Raytheon/Santa Barbara Research Center (SBRC) in Goleta, CA, under contract to SAO (Hoffmann et al. 1998; Estrada et al. 1998). In the cryogenic mission, channels 1 (FPA desig. 48534/34 UR) and 2 (48975/66 GSFC) used InSb arrays operating at ≈ 15 K, and channels 3 (30052/41 ARC) and 4 (30219/64 ARC) used Si:As detectors operating at ≈ 6 K. In the warm mission, the channel 1 and 2 InSb arrays were operating at about 30 K. Both array types used the CRC744 CMOS readout circuit, and the same physical pixel size of 30 µm. The arrays were anti-reflection coated with SiO (channels 1, 2, and 3) and ZnS (channel 4). The power dissipation for each array was < 1 mW. The quantum efficiencies were 87%, 86%, 37% and 61% for channels 1 - 4, respectively. The quantum efficiencies and the well depths (below) are from pre-flight laboratory measurements of similar arrays and antireflection coatings. The operability, or the percentage of the pixels that are within usable specifications, was 99.97%, 99.9%, 99.99%, and 99.75% for channels 1 – 4, respectively, during the cryogenic mission and 99.01% and 99.97% for channels 1 and 2, respectively, during the warm mission. The well depths were 145000, 140000, 170000, and 200000 electrons in channels 1 – 4, respectively, during the cryogenic mission. During the warm mission, they were 110000 and 125000 in channels 1 and 2, respectively. Table 2.3 gives the read noise values for IRAC channels 1 – 4 during the cryogenic mission, and for channels 1 and 2 during the warm mission.
2.3.2 Linearity
Both types of detectors had measurable nonlinearity. The InSb arrays were nearly linear until they reached saturation. The Si:As detectors were somewhat nonlinear over most of their operating range, and, above half-well capacity, this contributed noticeably to the total error budget. However, all of the arrays were linearized to better than 1% up to approximately 90% of their full-well capacity (defined in electrons above, with the gain listed in
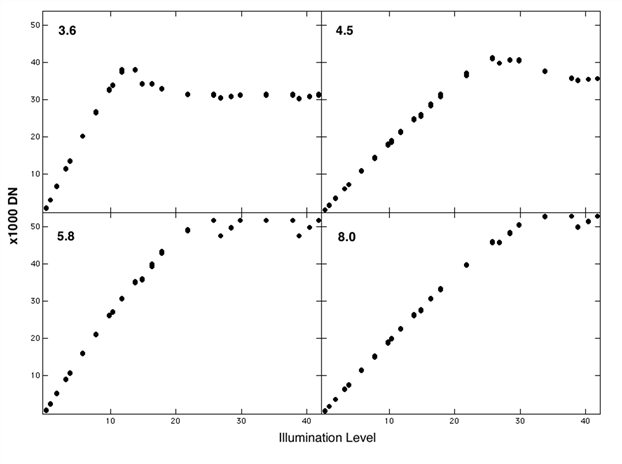
Table 2.4, corresponding typically to 45000 – 60000 Data Numbers; DN). The detector linearity was measured during ground testing and in flight. The laboratory linearity measurements, with the flight instrument, are shown in Figure 2.6. The arrays were illuminated with a constant flux, and successively longer exposures were taken. For a perfectly linear system, the flux would be directly proportional to the exposure time, and the graph would show a straight line. In fact, the arrays were driven past their saturation levels, and the shape of the curve up to 90% of the saturation level was fitted with a polynomial in the pipeline’s linearization module.
During IWIC, it was found that the non-linearity and well depth varied as both a function of applied voltage on the arrays and the array temperature. Therefore, the voltage and temperature were recalibrated during warm operations. Unfortunately, it was extraordinarily difficult to reach the accuracy of the ground-based cryogenic linearization while in flight. Therefore, the warm mission linearity calibration was derived using a combination of staring observations of bright galactic nebulae, and from the photometry of sources observed by the SERVS Exploration Science program, vs. the same sources observed by the SWIRE Legacy Science program during cryogenic operations. The warm mission linearity solution was found to be accurate at the level of better than 0.5%.
IWIC results indicated that the non-linearity at 27 - 28 K temperatures (warm mission) was more severe than at 15 K (cryogenic mission). Using the cryogenic calibration provided at least a partial correction. Note that the flux calibration was based on standard stars that were usually near 1/3 - 1/2 full well. Targets that were near this well depth will always have correct fluxes. The other change in the warm linearization was the well depth that is defined by the point at which the pixel DN peaks, and it was roughly 30000 DN in both channels in the warm mission, whereas it was closer to 44000 DN in the cryogenic mission.
Figure 2.6: Cryogenic linearity curves for the IRAC detectors. As noted in text, the warm detectors were roughly linear to 30000 DN.