2.10.2 Spectroscopic Sensitivity to Point Sources in the Faint-Source Limit
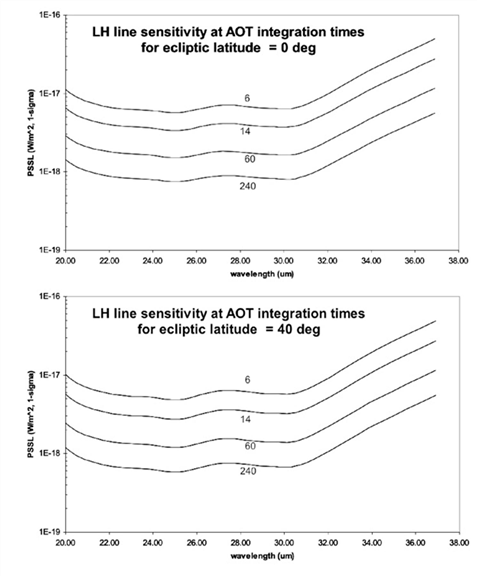
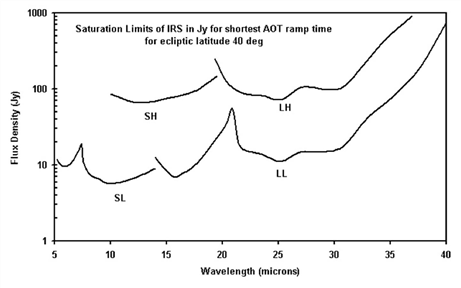
This section provides sensitivity curves for all four IRS modules. These sensitivities are based on pre-launch models that were refined using in-orbit measurements of point source flux calibrators, and take into account the degradation of the LL1 module that was discovered during CTA ground-testing prior to launch. Figure 2.14 shows a comparison between the four modules. Plots of the point-source single pointing continuum sensitivity of the SL and LL modules are shown in Figure 2.15 and Figure 2.16, respectively. Plots of the point-source single pointing (unresolved) line sensitivity of the SH and LH modules are shown in Figure 2.17 and Figure 2.18, respectively. These plots also show the sensitivities for the four observer-selectable integration times. Finally, Figure 2.19 shows the IRS digital saturation limits for bright point sources for the shortest ramp time (6 sec). Saturation is not necessarily fatal for an observation as the data processing pipeline reconstructs the ramp if at least two samples are available (albeit with a larger error than usual). However, very bright sources may leave latent imprints in the detectors that will compromise further observations until an anneal is performed.
In all of the figures shown in this section, it is assumed that the source is in the faint source limit (i.e., for a selected exposure time, the target flux is BELOW the relevant line shown in Figure 2.20. If the source is bright and lies above the line, then the curves shown in the following figures will significantly overestimate the expected signal-to-noise ratio. In Section 2.10.4 a simple scaling rule is given to convert the expected S/N ratio based on the (faint source) sensitivities to a more realistic value for bright sources.
In addition, all of the figures shown in this section assume that the source is a point source. If the source is actually extended, then the user should see Section 2.10.3 for information on how to correct the point-source sensitivies.
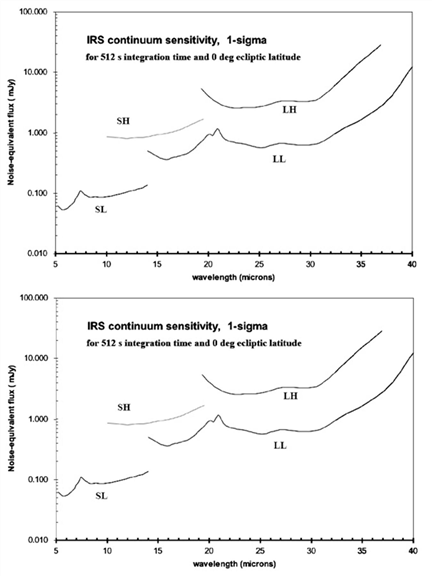
Figure 2.14: 1-sigma continuum sensitivity (in the faint source limit) of all four IRS modules in a 512 second integration with HIGH (top) and MEDIUM (bottom) backgrounds (the LOW background case, corresponding to an ecliptic latitude of 90o, is indistinguishable from the MEDIUM background case at the scale of these plots).
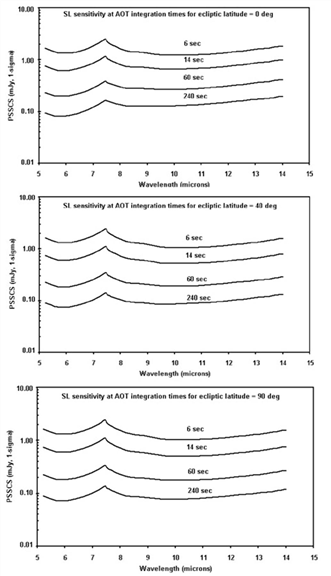
Figure 2.15: Short-Low 1-sigma point source staring continuum sensitivity (PSSCS) in the faint source limit after smoothing to a resolution of R = 50, with HIGH (top), MEDIUM (middle), and LOW (bottom) backgrounds.
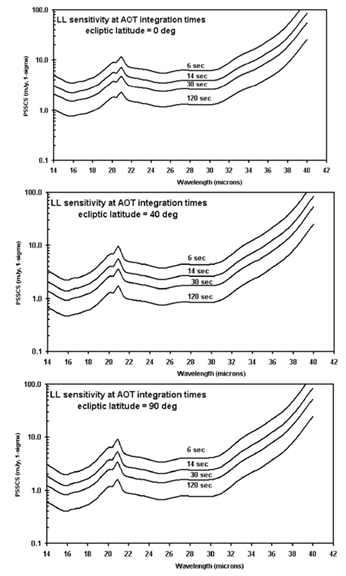
Figure 2.16: Long-Low 1-sigma point source staring continuum sensitivity (PSSCS) in the faint source limit after smoothing to a resolution of R = 50, with HIGH (top), MEDIUM (middle), and LOW (bottom) backgrounds. This figure includes the effects of the LL1 filter delamination discovered before launch.
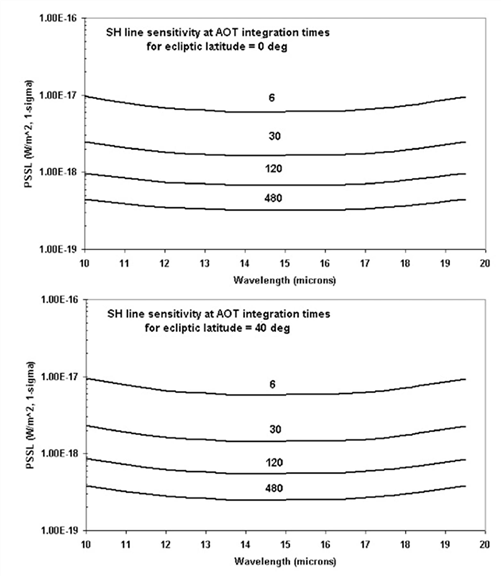
Figure 2.17: Short-High 1-sigma point source sensitivity (PSSL) to an unresolved emission line in the faint source limit, with HIGH (top) and MEDIUM (bottom) backgrounds (the LOW background case, corresponding to an ecliptic latitude of 90o, is indistinguishable from the MEDIUM background case at the scale of these plots).
Figure 2.18: Long-High 1-sigma point source sensitivity (PSSL) to an unresolved emission line in the faint source limit with HIGH (top) and MEDIUM (bottom) backgrounds (the LOW background case, corresponding to an ecliptic latitude of 90o, is indistinguishable from the MEDIUM background case at the scale of these plots).
Figure 2.19: Saturation levels for the shortest ramp duration available in the IRS AOTs, with MEDIUM background (the HIGH and LOW background cases, corresponding to ecliptic latitudes of 0o and 90o, respectively, are indistinguishable from the MEDIUM background case at the scale of this plot). For flux densities at a given wavelength that exceed these limits, at least one of the samples will be saturated. Flux densities up to 3 times greater will have at least two unsaturated samples.