The observed mean spatial profile at a given wavelength, obtained from the averaged mosaic image of the observations of the bright calibration stars, was compared with one predicted by the Spitzer TinyTim model (Krist 2000). The model image was first smoothed by a boxcar of 9.8'' in width before the spatial profile was generated for the SED slit. The agreement between the observations and the model prediction is fairly good except for at large radii, where cirrus contamination and flux nonlinearity need to be more carefully evaluated. Table 4.5 tabulates the adopted aperture corrections using the smoothed model PSF for two aperture sizes.
Table 4.5: Aperture Corrections.
Detector Row
λ ( micron)
Caper (5 cols)
Caper (3 cols)
1
52.556
1.574
1.748
2
54.266
1.600
1.770
3
55.976
1.626
1.793
4
57.686
1.652
1.815
5
59.395
1.678
1.837
6
61.106
1.706
1.86
7
62.816
1.735
1.882
8
64.525
1.763
1.905
9
66.236
1.792
1.927
10
67.946
1.821
1.95
11
69.656
1.85
1.972
12
71.365
1.878
2.000
13
73.076
1.905
2.028
14
74.785
1.933
2.056
15
76.495
1.96
2.084
16
78.206
1.987
2.112
17
79.916
2.015
2.141
18
81.626
2.04
2.175
19
83.335
2.065
2.21
20
85.046
2.09
2.245
21
86.756
2.115
2.28
22
88.465
2.14
2.315
23
90.175
2.166
2.35
24
91.886
2.191
2.392
25
93.596
2.216
2.434
26
95.305
2.241
2.476
27
97.016
2.266
2.518
Comparison with Models and Previous Observations
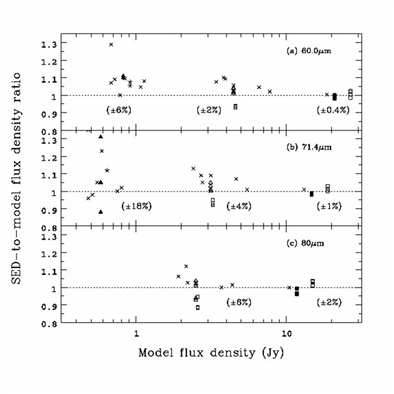
An empirical way to derive an absolute calibration accuracy is to compare SED measured fluxes with the model predicted values for stars not used in the derivation of the spectral response function. This is shown in Figure 4.3 at three representative wavelengths: 60, 71.4 and 80 micron. From these data, it is reasonable to conclude that a flux accuracy better than 10% is achieved down to a flux density of ~0.5 Jy at the blue end of the spectra, or a couple of Janskys near the red end. This empirical accuracy estimate includes uncertainties in the stellar model fluxes.
In Figure 4.3 the faint stars apparently have a lower spectral response than the bright stars. This is most noticeable at 60 micron (see Figure 4.3a), at which the difference is on the order of 5-7% over the 70 micron flux range of 0.5-18 Jy. It is plausible that part of this apparent flux dependency can be attributed to the flux nonlinearity.
A number of calibration stars have been observed in multiple campaigns. These include stars of all three flux levels (cf. Figure 4.3). The results indicate a fairly high flux repeatability in time: the r.m.s. difference goes from ~2% near the blue end of the spectrograph to better than 5% near the red end.
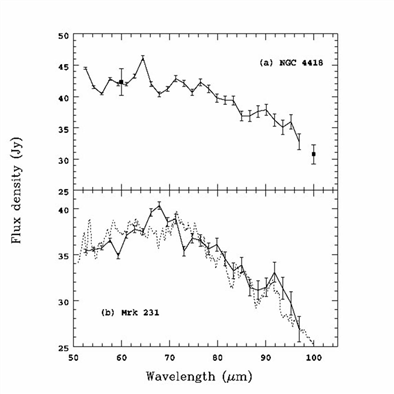
Figure 4.4 compares MIPS/SED fluxes with IRAS 60 and 100 micron fluxes for the galaxy NGC 4418, and with ISO LWS data for the galaxy Mrk 231. The results from these cross-comparison analyses are all consistent with that the absolute flux calibration of the SED mode is accurate to 10% or better for point sources.
Figure 4.3: The ratio of the measured-to-predicted flux densities for SED calibration stars at (a) 60 micron, (b) 71.4 micron, and (c) 80 micron, as a function of the predicted 71.4 micron flux density. Stars observed in multiple campaigns are distinguished by different symbols to indicate the degree of measurement repeatability; those stars observed only once are each represented by a cross. The number in a pair of brackets indicates the typical statistical uncertainty for a measurement in the group of stars of comparable fluxes.
Figure 4.4: Comparisons of SED fluxes (as a solid line) with IRAS 60 and 100 micron fluxes for the galaxy NGC 4418 in (a), and with an ISO-LWS spectrum (dotted line) from ISO archive (TDT = 18001306) for the galaxy Mrk 231 in (b). The IRAS data, taken from Soifer et al. (1989), are assigned with an 5% error bar here. The LWS data have been cleaned up and smoothed with a box car of 7 ISO-LWS pixels in width.
Pointing Offsets and Flux Systematics in Some Campaigns
The targets are slightly off the slit center line in early campaigns for chop throws other than the +1' one. There had been a few updates in the IPP files to those parameters controlling the chop throw-related pointing in the SED mode. As a result, for a given chop throw, its typical pointing offsets (from the center line of the slit) may be different in different campaigns.
Table 4.6 below shows in which campaign a pointing adjustment was made. The corresponding measured pointing offsets are given in Table 4.7. Since the SED flux calibration is carried out with the +1' chop throw where little pointing offset has been seen, the calibrated flux of a point source is underestimated by a small percentage in the campaigns where the selected chop throw has a non-zero pointing offset in Table 4.7. This flux underestimate is on the order of -5% (-10%) for an offset of �2.4'' (� 4.8'').
Table 4.6: Timeline of MIPS/SED IPP File Updates.
Campaign No.
+1' chop
+2' chop
+3' chop
-1' chop
Pre-MC19
None
None
None
None
MC19
None
None
Updated
None
MC21
None
Updated
Updated
Updated
MC23
None
Updated
Updated
Updated
Post-MC23
None
None
None
None
Table 4.7: Estimated Pointing Offsets.a
Campaign No.
Obs. Dates
+1' chop
+2' chop
+3' chop
-1' chop
MC20 or earlier
Prior to 04/14/05
0.0''
+1.2''
+2.4''
+2.5''
MC21 and MC22
05/10/05-06/29/05
0.0''
+2.6''
+4.8''
+5.3''
MC23 or after
& After 07/25/05
0.0''
+0.8''b
+0.6'' b
+0.0''
a A positive offset is defined to be in the direction of increasing detector row.
b These offsets should be acceptable because the pointing jitter from the scan mirror could be up to 1''.
Extended Source Flux Calibration
Since the SED flux calibration is based on stars, both aperture correction uncertainty and the illumination residual effect have little impact on the flux of a point-source observation. However, they do introduce some additional uncertainties to the surface brightness calibration of an extended source. Table 4.8 summarizes the error budget for the case of extended sources, in which the total flux uncertainty is estimated to be on the order of 15%.
Table 4.8: Error Budget for Flux Calibration of Extended Sources.
Error Source
Estimated Error
Point-source flux uncertainty
<= 10%
IC uncertainty after columnwise correction
~5%
Aperture correction uncertainty
<= 10%
Total
~15%
Remarks on Flux Nonlinearity
MIPS Ge detector flux nonlinearity is addressed using calibration data taken in the 70 micron imaging mode, which is more sensitive than the SED mode. No significant (i.e., < 10%) flux nonlinearity is seen in the SED mode over a flux range of 0.5 to ~40 Jy at 70 micron. However, for a flux far outside this range, the flux nonlinearity could be increasingly important. Without a proper correction for it, the systematic effect from a flux nonlinearity would be an underestimate (overestimate) of the real flux of a very bright (faint) source.