The conversion of signal to equivalent monochromatic flux density at the weighted average wavelength for the observation depends on the slope of the spectrum of the source across the MIPS bands. For the purposes of comparing sources with differing spectral behavior, the observed fluxes should be color-corrected. Such correction is also required to obtain accurate flux densities. In Table 4.16, we tabulate the color corrections for a representative range of blackbody source temperatures, and Table 4.17 contains color corrections for power laws. Source flux densities produced by pipeline processing of MIPS data at the SSC do not include color corrections - the observer is responsible for determining whether color corrections are necessary and for applying them.
Table 4.16: Nominal color corrections vs. blackbody source temperature.
λ ( microns)
Source Temperature (K)
104
5000
1000
500
300
200
150
100
70
50
30
20
23.68
1.000
0.999
0.992
0.983
0.970
0.957
0.948
0.947
0.986
1.119
2.031
7.005
71.42
1.000
0.999
0.995
0.989
0.980
0.970
0.959
0.938
0.914
0.893
0.901
1.052
155.9
1.000
1.000
0.999
0.997
0.996
0.993
0.991
0.986
0.979
0.971
0.954
0.944
Table 4.17: Nominal color corrections for power laws.
Power law indices (alpha) where
λ ( microns)
-3
-2
-1
0
1
2
3
23.68
0.967
0.960
0.961
0.967
0.981
1.001
1.027
71.42
0.933
0.918
0.918
0.932
0.959
1.001
1.057
155.9
0.965
0.959
0.959
0.965
0.979
1.000
1.029
The flux of a source is typically determined relative to calibrator stars using the ratio of the stellar and source signals. The nominal flux derived in this manner must be corrected in order to derive the true monochromatic flux density at the weighted average wavelength for the band by dividing by the appropriate factor in Table 4.16. The result will be the 'best estimate' of the true monochromatic flux density of the unknown source at the weighted average wavelength. The photometric bandwidths of the MIPS filters were selected to make these corrections modest, except for sources whose blackbody spectral energy distributions peak at wavelengths longer than the photometric band. In these cases, large corrections are unavoidable; observers measuring cold objects should take note.
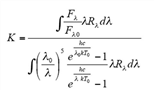
Note that MIPS and IRAC calculate color corrections slightly differently; the origin of this difference is that our response functions are in slightly different units. As such, to reproduce the color corrections displayed here, you will need to do the following. Take the response functions from the website (units of electrons per unit energy) and divide by lambda (to get electrons per photon). MIPS defines λ 0 as follows:
(4.1)
where Rλ is the response function in units of electrons per photon. MIPS color corrections are referenced to a 10,000 K blackbody:
(4.2)
where :
T0=10,000 K, l0=23.675 microns at MIPS-24, l0=71.440 microns at MIPS-70, l0=155.899 microns at MIPS-160, and hc/k = 14388 microns x K
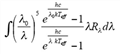
For an input blackbody at Teff, the numerator of equation 4.2 becomes:
(4.3)
and for power laws, the numerator becomes (alpha=2 for the Rayleigh-Jeans limit):
(4.4)
Users should DIVIDE by the color-corrections (K) given in Table 4.16 and Table 4.17 to convert the observed flux densities to real flux densities.