BCD images have been fully corrected for all basic instrumental effects. The file names of the SED BCD products follow the same convention as the 70 micron image mode (Table 6.2). However, for the SED mode one should use only the unfiltered BCD images for further analysis or mosaicking.
Each BCD flux image is a FITS file with the dispersion axis along the vertical Y-axis. The blue end of the spectrum is at the bottom of the image. The pixel size along the (horizontal) spatial axis is 9.8'' (CDELT1). The dispersion solution is given by the header keywords CRVAL2, CRPIX2 and CDELT2, which lead to a dispersion scale of 1.70 micron/pixel and the center of the first detector row corresponding to 52.55 micron (see section 4.2.1 for more details on the wavelength calibration). The effective wavelength coverage is 51.7-97.8 micron over detector rows 1-27. The final 5 detector rows, which are contaminated by second-order diffracted light, are not calibrated. An inoperative detector module restricts the wavelength coverage to only 65-97 micron over the last 4 columns of the 16x32 detector array. The astrometry of each BCD image is given by the header keywords RA_SLT, DEC_SLT and the slit orientation on the sky (PA_SLT, which is defined to be from North to the BCD image positive X-axis in a counter-clockwise direction). One way to identify stim exposures is look for the BCD files with a non-zero value for the header keyword STMFL_70.
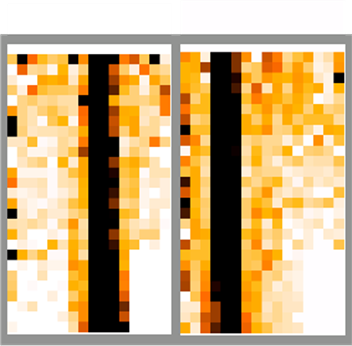
Figure 6.1: Illustration of two typical BCD images taken respectively at the two dither positions of the SED mode. Note that the target is placed near the centers of the detector columns 10 and 5 at dither positions 1 and 2, respectively.
The SED flux calibration is based on a set of calibration stars with a pre-determined far-infrared spectrum (see section 4.2.3 for more details). The flux scale of a BCD image is in units of MJy sr-1. This is derived from the calibration star observations as follows:
flux scale = Fν(λc)/Σ/A
(6.3)
where Fν(λc) is the stellar flux density at the central wavelength λc of the detector pixel under consideration, Σ is the MIPS number counts within an aperture of 5 detector columns centered at the calibration star, and A is the angular size of each detector pixel, which is assumed to be a square of 9.8'' x 9.8''. As a result, one arrives at a true point-source flux density in Jansky by (i) adding together the BCD pixel values over a 5-detector column aperture centered on the target and then (ii) multiplying the sum by A.
For a spectrum of an extended source or a point source extracted with an aperture other than the default one of 5 detector columns, correct fluxes can be derived using the aperture correction factors in Table 4.5 in section 4.2.4.
One should also be aware of the fact that the flux scale is calibrated using the sky-subtracted, mosaicked images (see section 4.2.3) of the observed calibration stars. There could be a small systematic flux difference between the two dither positions at the BCD level due to a residual illumination correction issue (see section 4.2.2). It is therefore advised that, if possible, one should always use the mosaicked image for formal photometry.
There are a number of remaining issues at the BCD level, including a small spectral tilt of about 1º (given by the BCD header keyword CROTA2) and some small array distortion. Corrections for these issues are addressed in the post-BCD data process (see section 6.4.1).
6.3.3 BCD Uncertainties
The error images currently provided with the 70 and 160 micron BCDs are rough uncertainty estimations and do not include all of the systematic effects associated with the Ge:Ga detectors. These error images also do not include the absolute flux uncertainty. The uncertainties include an empirical error on the slope calculation based on the dispersion of the data along the ramp, an estimated 5% uncertainty on the individual measurements of the stimflash signal, and the errors associated with the DARK and IC (illumination correction) calibration files. The errors on the calibration files represent the dispersion of the calibration DCEs about the median value (per pixel)