IRAS Explanatory Supplement
XI. Known Processing Anomalies
J. Overestimated Weak Fluxes
Table of Contents | Index | Previous Section | Next Section
There is a systematic error associated with the measured flux densities, particularly those of moderate quality, near the noise limit of the detectors, which can increase the quoted value by as much as a factor of two compared with the true value. Weak sources were often detected when positive noise excursions dropped the signal below the SNR cutoff and so were not included in the flux averaging. While the problem is complicated by the uneven sensitivities of the detectors, a simple analysis demonstrates the problem and leads to a simple correction factor.
Assume that all of the noise sources are Gaussian and neglect spikes and cosmic ray hits as second order effects (see Sec VII.D of the Supplement). Define
The noise level =
The true source flux density, ftrue = n
The flux threshold = m
The measured flux density, fobs = n'
A source will be detected whenever the measured flux density exceeds the threshold, i.e. n' > m. For a perfectly uniform focal plane with no failed detectors the fraction of times, p, that a source was seen is given by:

(XI.J.1)
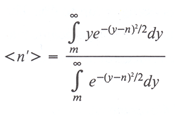
The expectation value of the observed flux density is given by the average of all detected values,

(XI.J.2)
Then the expectation value of the ratio of the observed flux density to the true flux density is given by

(XI.J.3)
The fraction of possible times the source was detected, p, (Eqn. XI.J.1) can be used to estimate the fractional amount, <n'/n> (Eqn. XI.J.3) by which the source's flux density was overestimated. Table 1 gives the relationship between p and <n'/n> for two SNR thresholds, 2 and 3
and 3 , to bracket the range of sensitivities of the focal plane detectors. To use the table, one must determine from the Working Survey Data Base the number of times the source should have been seen and the number of times it actually was seen. The ratio of those two numbers is approximately equal to p which can then be used to estimate a correction factor to the quoted flux density using Table XI.J.1.
The correction factor has been verified by using the moderate quality detections at 25 µm of hot stars with accurate 12 µm detections. At low flux levels the 12 µ, - 25 µm flux density ratio deviates from the Rayleigh Jeans limit. Application of this correction algorithm reduces this error considerably.
It should be emphasized that this correction procedure ignores the effects of radiation hits and of extra sensitive detectors. For cases where very accurate photometry is required, one should co-add the survey data.
Relation between Fraction of Possible Sightings (p) and Flux Overestimate (<n'/n>)
| Frac. of Sightings |
Flux Overestimate SNR THRESHOLD |
|
|---|---|---|
(=2 ) ) |
(=3 ) ) |
|
| p | <n'/n> | <n'/n> |
| 0.16 | 2.51 | 1.76 |
| 0.31 | 1.76 | 1.60 |
| 0.50 | 1.40 | 1.27 |
| 0.69 | 1.20 | 1.15 |
| 0.84 | 1.10 | 1.07 |
| 0.94 | 1.04 | 1.02 |
Table of Contents | Index | Previous Section | Next Section