|
HIRES is an excellent amplifier of the peculiarities of the IRAS data, in particular, HIRES users should be familiar with the AC/DC effect and point source tails. These are discussed in the section on IRAS data characteristics. The following are the more common artifacts generated during HIRES processing. However, there may be others that have crept into your images, and you are warned to carefully consider any features which seem unusual or confusing. You should examine all maps and ancillary maps, and in some cases consider doing a simulation. Ringing
A ring of low flux may appear around a point source. This ring can contain up to 10% of the flux of the point source. Ringing increases the uncertainty in the background estimation for aperture photometry. Ringing most commonly occurs on relatively high backgrounds. Changing de-striping methods or using a different flux bias may help. Blank Pixels/Coverage Depletion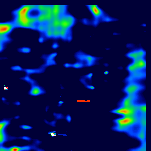 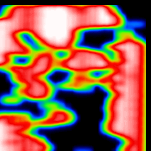 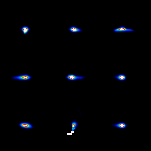
By default, YORIC discards any negative data values passed to it. With baseline removal de-striping in highly confused fields, baseline overestimation can result in large negative regions if no flux bias is applied. When these negatives are discarded, regions of low --- or in extreme cases, no--- coverage result. Also, in some cases, there may be very little actual detector coverage in a region. Regions of no or low coverage are prone to develop emission features which are clearly non-physical; they may appear sharp-edged and smaller than any point source in the field. Photometry in low coverage regions is suspect, even in the absence of artifacts. Low coverage regions are easily identified in the coverage map. Where the region has resulted from de-striping problems, changing the flux bias may help. This was a very common problem before the application of a flux bias was made the default with baseline removal de-striping. Aliasing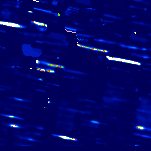 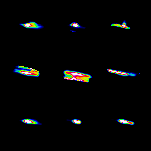 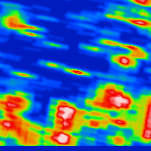
Aliasing occurs typically at 12 and 25 µm in low coverage areas. Instead of being essentially a two dimensional gaussian, the effective beam takes on a highly complex, unreasonable shape, rendering interpretation of image structure exceedingly difficult. IMPORTANT--Please see also the material on characteristics of the IRAS data!It contains information on stripes, optical crosstalk and other inherent problems in the IRAS data which may be particularly obvious in HIRES images.
|

