|
Version 6.0 of Scanpi (released in 2007) was a re-write of the classic software, Scanpi, version 5.0.
There is a list of differences between the
classic and new version. In order to illustrate some of these
differences, both versions of Scanpi have been run on the extended
source IRAS 03419+6756 (aka IC 342), and some of the
results for Band 1 (12 microns) are used below to explain a few of the key
software changes.
Fitting & Display Parameter Ranges
Classic Scanpi default fitting parameters limited the user to a narrow
range and view around the source center (for Band 1, +/- 7.5 arcmin) .
The tabular and graphical data left the
user with the impression that the background around the source is flat.
Figure 1 below, shows the median coadd scan (#1002) for
classic Scanpi. Note that there is no option in classic Scanpi
to change the display range of the plot, and therefore is it not possible
to see beyond the narrow fitting range.
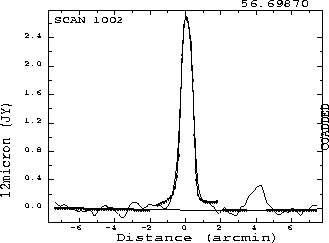
Figure 1
Using the new Scanpi, one can see that the source is actually
a galaxy containing a bright nucleus (Figure 2). The default parameters fit
the individual scan global background to +/- 60 arcmin, followed by a
local background of +/- 30 arcmin. One can set the display range to +/- 30 arcmin
to see the galaxy distinctly above the background level, along with the
bright central source. One can reset the fitting parameters to better
fit a particular source. Intermediate plots are accessible to see
every step of the new Scanpi processing. Figure 2 shows the median coadd scan
(#1002) for new Scanpi. On the left is a zoomed out view +/- 30 arcmin
of center, with default fitting; on the right is a re-fit using +/- 8.0 arcmin as the
local background fit and view range, +/- 3.0 acrmin for source fit exclude range. Note,
depending on how the global and local background were fit, the peak amplitude
and flux between the classic and new versions of Scanpi may differ.
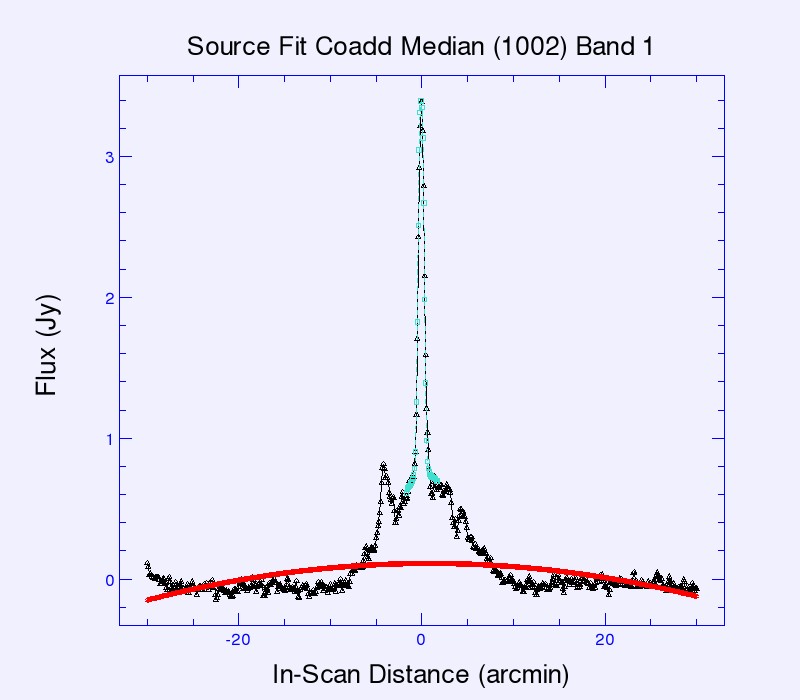
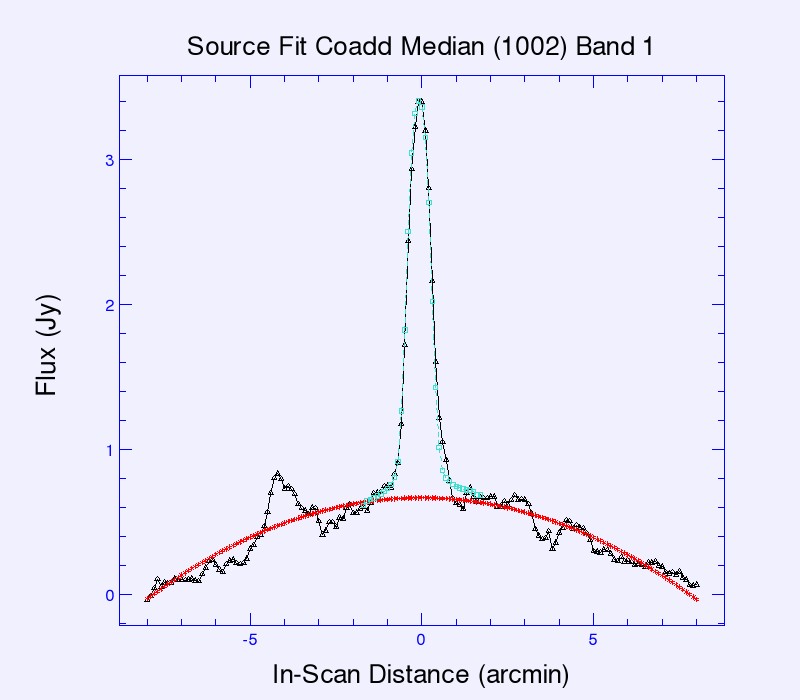
Figure 2
Scan Direction
Displayed results from classic Scanpi vs. new Scanpi may be flipped with respect
to the source center (zero). Figures 1 and 2 are flipped; in Figure 1, the
smaller of the two peaks is to the right of center (positive) and in Figure
2, this feature is to the left of center (negative). Therefore the Scanpi "miss" value
(the in-scan deviation of signal peak from the user-specified target position in arcminutes)
should be thought of in terms of absolute value offset from zero. The user should
be aware that a majority of the results using the new Scanpi are flipped with respect to
classic Scanpi.
The new code chooses the nominal scan direction
so that the majority of scans will be 'forward'; the rest are 'reverse'.
Classic Scanpi used different logic, with the 'forward' scans controlled by
whichever one was closest to going due North. Figure 3 below shows the scan tracks
for classic Scanpi (on the left) and new Scanpi (on the right). Scan number are
written at the beginning of the scan to indicate direction, in both diagrams.
Classic Scanpi scans are mostly from top left towards bottom right (pointing southeast).
The new Scanpi scans are mostly from bottom right towards top left (pointing northwest).
Direction is basically arbitrary, as long as the logic of reversed scans from the
primary direction are noted correctly with respect to the system chosen. Classic
and new Scanpi are consistent in terms of the number of scans in one direction
vs. the opposite direction.
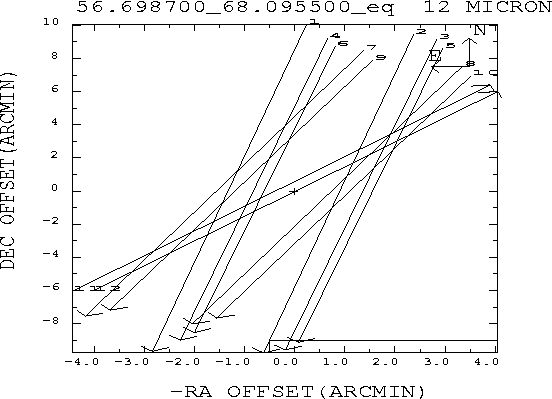
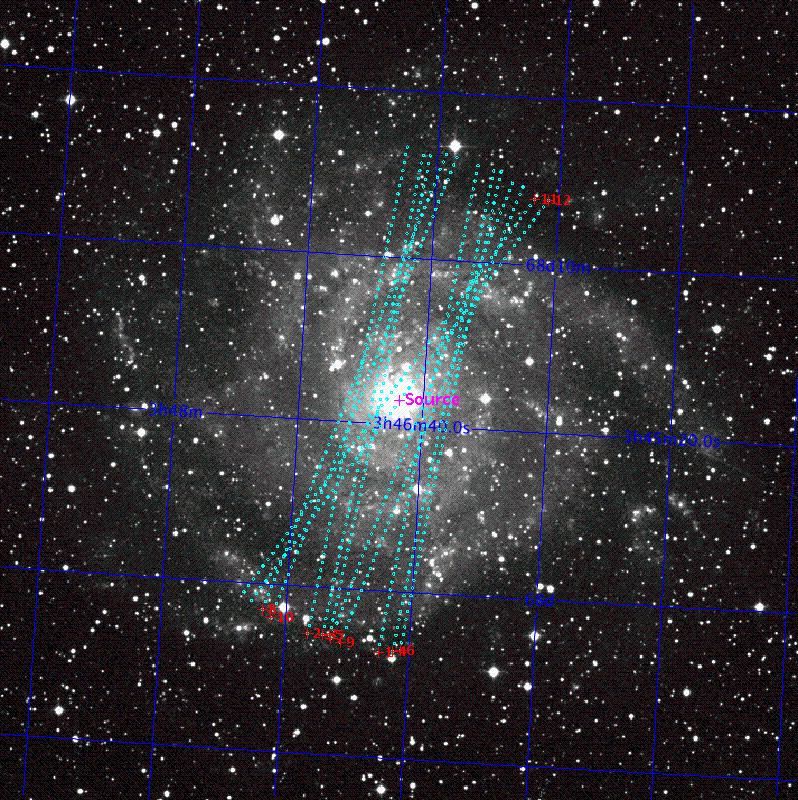
Figure 3
Template for Source Fitting
Source fitting uses a point source template to calculate the best fit with the lowest correlation coefficient.
There are three templates available for fitting - a forward direction template, a reverse direction template and
an average of those two. Classic Scanpi used either the forward or reverse template for individual scan source fitting,
depending on the direction of the scan. It used the average template for all coaddition source fitting.
The new Scanpi used the same template logic for the individual scan source fitting. However, for the
coadd source fitting, new Scanpi chooses the template according to a 2/3rds major direction of the scans. For example,
if more than 2/3rds of the scans in the coadd are forward, then the forward template is used for
source fitting. If more than 2/3rds of the scans in the coadd are reverse, then the reverse template
is used for source fitting. If there is no 2/3rd majority, then the average template is used.
This affects the "amp" and "corr_coef" results.
The scan tracks in Figure 3 above show that this source had all but two scans traveling in one direction.
Classic Scanpi refers to the majority of the scans as all being "reverse", and two being "forward". In the
coadd source fitting, the average template was used to fit the source. In the new Scanpi, all but two the
scans are considered "forward". In the coadd source
fitting, the forward template was used to fit the source since more than 2/3rds of the scans are forward.
SIGMA and SNR Values
SIGMA, and therefore SNR, are calculated differently for the classic and new versions of Scanpi.
Classic Scanpi uses the "goodness" of the coadd background fit (within the fitting range, minus the
source exclude range) as SIGMA.
The new version of Scanpi gives access to the data files associated with the individual scans
and coadded scans, for every step of processing. The user can use these data files themselves
as a check on the SIGMA calculations or use their own if they so choose. SIGMA is calculated as
the square root of the variance, where variance is the average of the squared differences
between data points and the mean. For the individual scans, the entire +/- 60 arcmin range
(minus the source exclude range) is used in the SIGMA calculations. For the coadded scans,
the background fitting range (minus the source exclude range) is used for coadd scan SIGMA
calculations.
In both versions of Scanpi, one needs to multiply calculated SIGMA by 1000 to match the
tabular results, since the units are in mJy. Also in both versions, signal-to-noise (SNR)
calculations are the same, where SNR = PEAK/SIGMA. The SNR values are different for the
two versions, since they depend on SIGMA.
|