 The Two Micron All Sky Survey at IPAC
|
|
|
 Aitoff projection of the three-color composite JHKs source
count map of the
entire sky, based on 95,851,173 stars with Ks
Aitoff projection of the three-color composite JHKs source
count map of the
entire sky, based on 95,851,173 stars with Ks
 13.5. What appears most prominently are the Galactic plane and the Galactic
bulge. The plane is cut by dark dust lanes and clouds, even in the
near-infrared, and several dusty regions, including Orion, are conspicuous.
One can also see the two Magellanic Clouds, Large and Small. (Note the
prominent bar and incipient spiral structure of the Large Cloud.) Near the
Small Magellanic Cloud is the globular cluster 47
Tucanae. Cutting almost
north-south through one side of the bulge is the dwarf Sagittarius galaxy,
which, along with the Clouds, is a satellite of the Milky Way. 2MASS has
completed the observational part of the survey and is now preparing to
reprocess all of the data for a Final public Release, in late 2002.
The source generation was performed by M.F. Skrutskie (UMass; Principal
Investigator, 2MASS), the flux maps were compiled by J.M. Carpenter (Caltech),
and the color composite was assembled by R. Hurt (IPAC/Caltech). It is this
composite flux map that comprises the new 2MASS logo, seen above.
(Image size 2.0 Mb!)
13.5. What appears most prominently are the Galactic plane and the Galactic
bulge. The plane is cut by dark dust lanes and clouds, even in the
near-infrared, and several dusty regions, including Orion, are conspicuous.
One can also see the two Magellanic Clouds, Large and Small. (Note the
prominent bar and incipient spiral structure of the Large Cloud.) Near the
Small Magellanic Cloud is the globular cluster 47
Tucanae. Cutting almost
north-south through one side of the bulge is the dwarf Sagittarius galaxy,
which, along with the Clouds, is a satellite of the Milky Way. 2MASS has
completed the observational part of the survey and is now preparing to
reprocess all of the data for a Final public Release, in late 2002.
The source generation was performed by M.F. Skrutskie (UMass; Principal
Investigator, 2MASS), the flux maps were compiled by J.M. Carpenter (Caltech),
and the color composite was assembled by R. Hurt (IPAC/Caltech). It is this
composite flux map that comprises the new 2MASS logo, seen above.
(Image size 2.0 Mb!)
 Atlas Image mosaic showing the Galactic Plane (the Plane
of the Milky Way). The Galactic Center is the very luminous
Ks-bright (reddish) source south of the image
center. (The image is centered at RA=17h46m22.0s Dec=-27d58m20s [J2000].)
This mosaic contains more than 1 million stars. Visible, even in the
near-infrared, are the obscuring dust lanes that fill the Plane between us and
the Galactic Center, located about 8.1 kpc (26400 light-years) away. However,
with 2MASS, we are able to see farther through this dust than can be
accomplished at visible wavelengths.
Image mosaic by E. Kopan (IPAC). (Field size 2.2° × 3.9°.
Image size 626 kb.)
Atlas Image mosaic showing the Galactic Plane (the Plane
of the Milky Way). The Galactic Center is the very luminous
Ks-bright (reddish) source south of the image
center. (The image is centered at RA=17h46m22.0s Dec=-27d58m20s [J2000].)
This mosaic contains more than 1 million stars. Visible, even in the
near-infrared, are the obscuring dust lanes that fill the Plane between us and
the Galactic Center, located about 8.1 kpc (26400 light-years) away. However,
with 2MASS, we are able to see farther through this dust than can be
accomplished at visible wavelengths.
Image mosaic by E. Kopan (IPAC). (Field size 2.2° × 3.9°.
Image size 626 kb.)
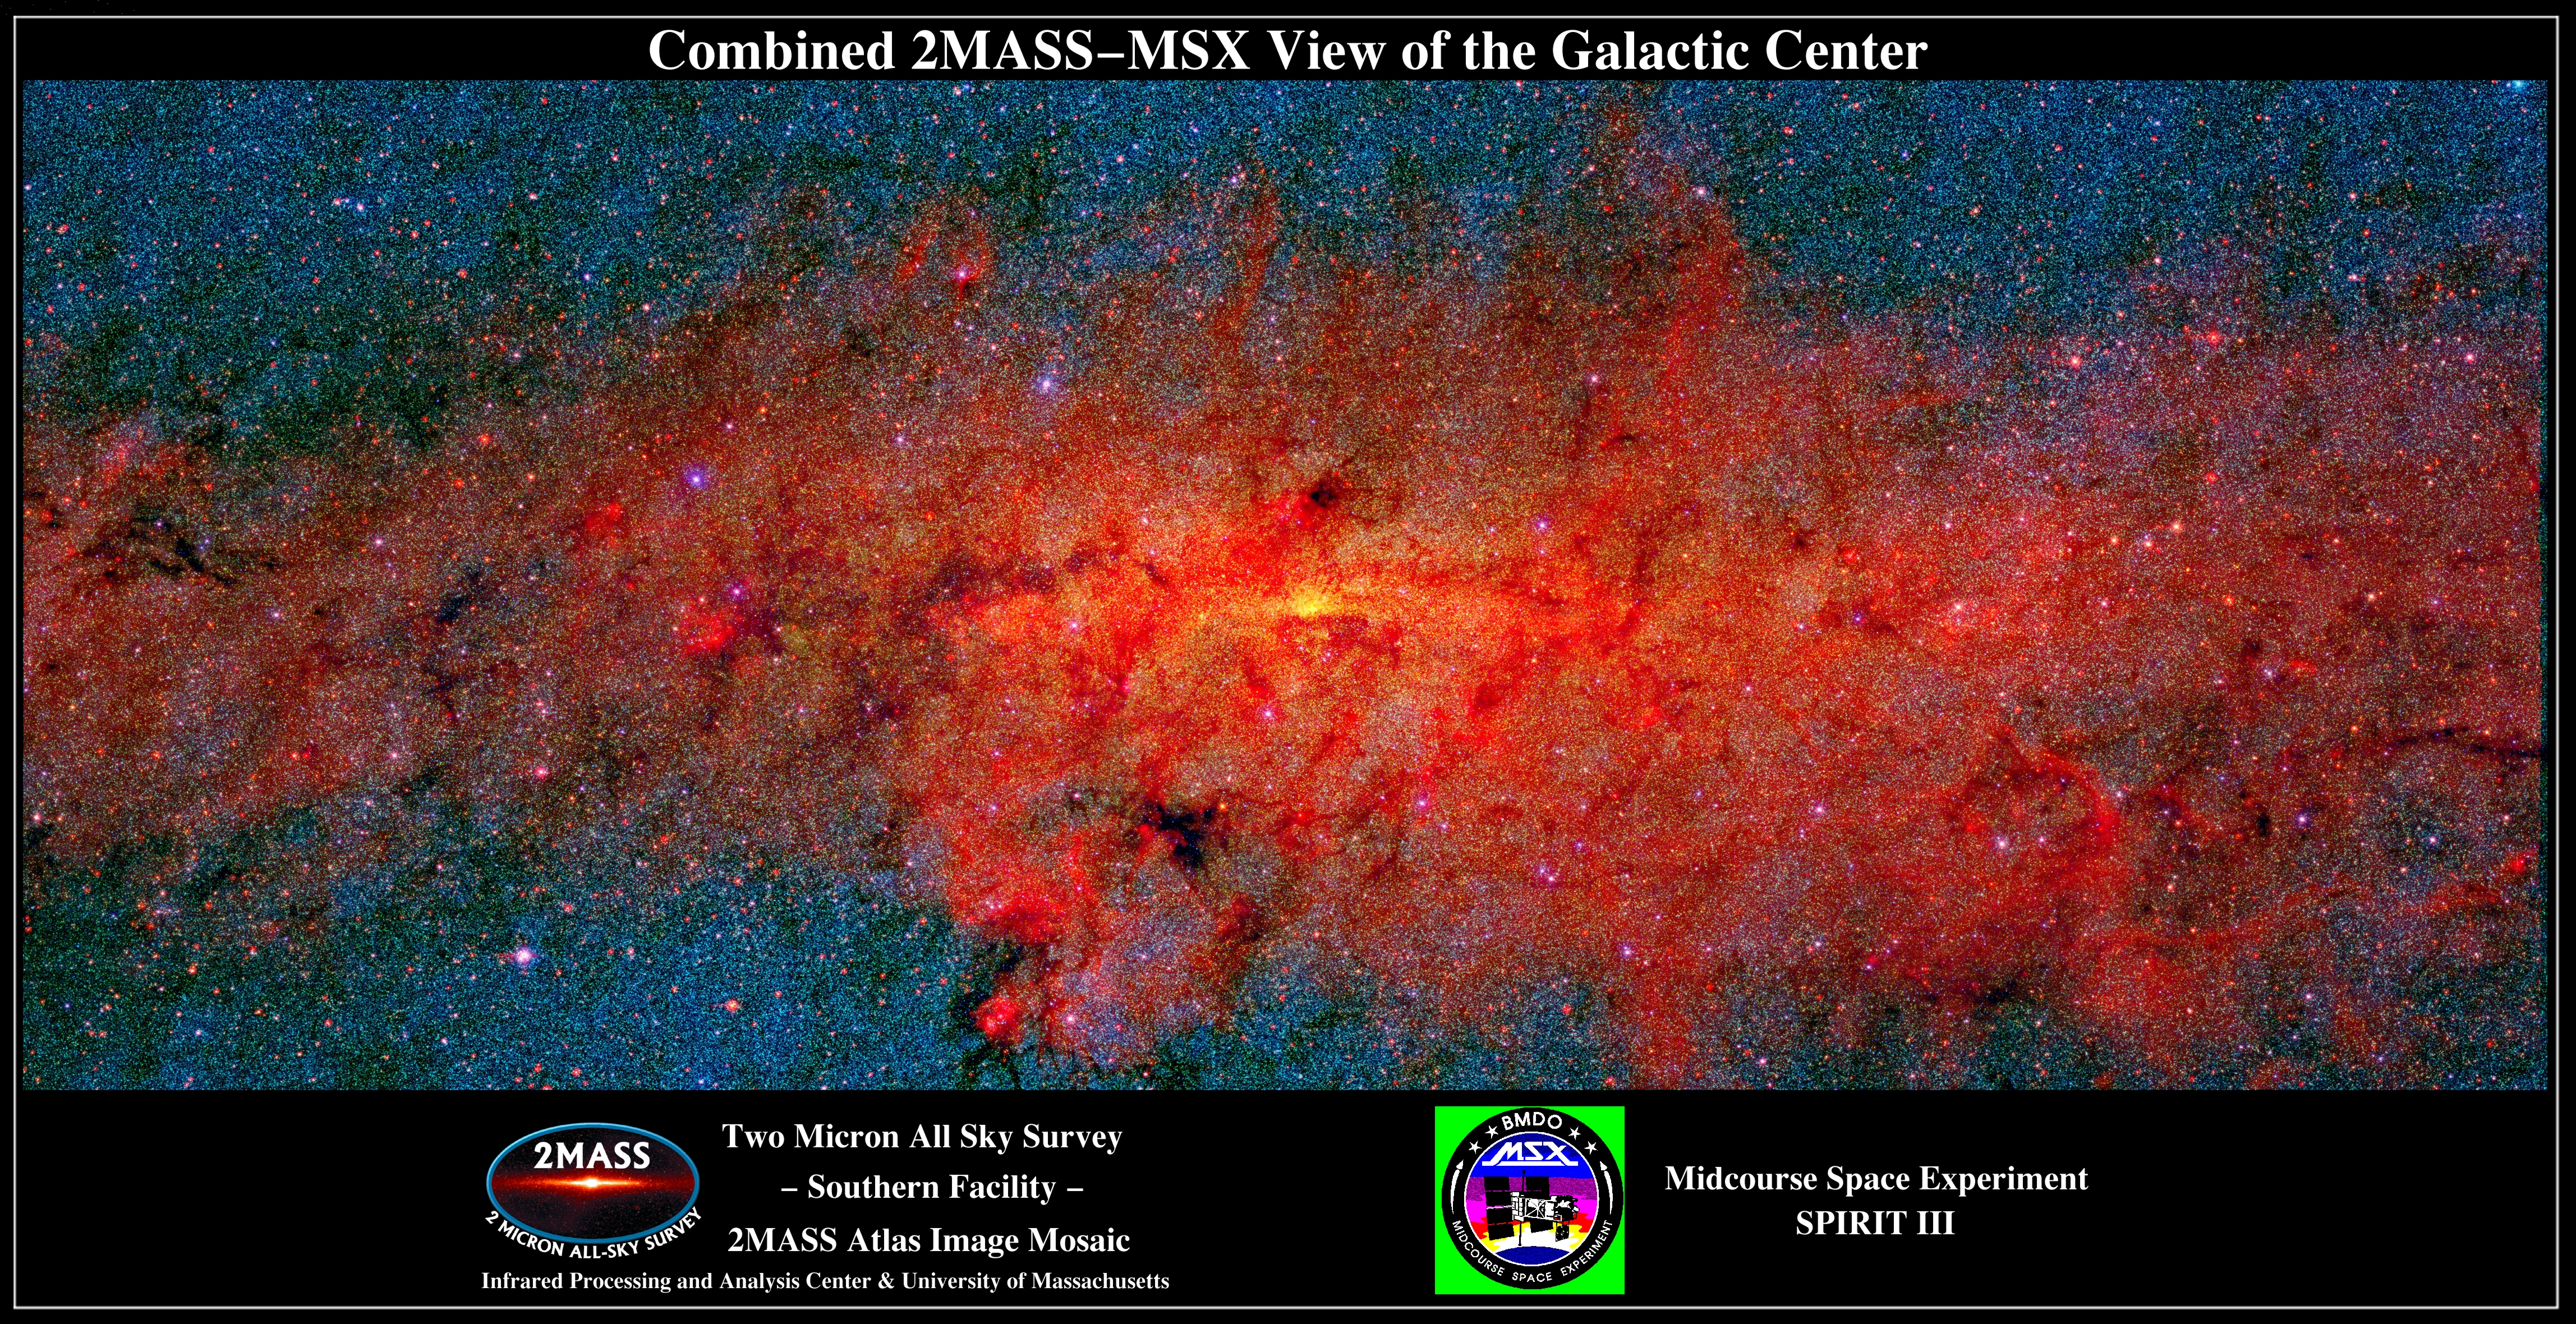 The Spatial Infrared Imaging Telescope, SPIRIT III, was the primary instrument
for gathering mid-infrared data during the
Midcourse Space Experiment (MSX)
mission.
One of the main targets for MSX and a fascinating target for 2MASS is the
Galactic Center. This image is a composite of 2MASS J (blue),
Ks (green), and MSX Band A (6 - 11 µm; red)
imaging of this region (the 2MASS image mosaic has been binned to
2´´ × 2´´ pixels).
The Galactic plane runs horizontally along the image, and
the Galactic center is the bright (yellow) object near the middle. The
infrared can peer through the dense obscuring dust that hides the Galactic
center in the optical. The near-infrared is sensitive to the photospheric
emission from the very large number of, particularly cooler, stars seen toward
this region, and also gives us a glimpse of the mass of stars and gas that
comprise the very center of the Milky Way. The mid-infrared is ideal for
measuring the thermal emission from the cool dust in nebular ionized (H II)
regions and molecular clouds, producing the extended clumpy and filamentary
emission surrounding the center. Although MSX Band A is still sensitive to
stellar emission, the cool extended emission becomes apparent, relative to the
2MASS bands, and the Galactic center becomes more obvious. Even with the
penetrating power of these infrared wavelengths, however, large ``holes'' can
be seen throughout the image, where no emission in any of these bands can
emerge from objects behind the dark dust.
2MASS Image mosaic and 2MASS-MSX image combination by E. Kopan (IPAC).
Featured as an
Astronomy Picture of the Day!
(Field size 2° [galactic latitude] × 5° [galactic longitude].
Image size 10.5 Mb! For the full-resolution
11.6-Mb version of this image, click here.)
The Spatial Infrared Imaging Telescope, SPIRIT III, was the primary instrument
for gathering mid-infrared data during the
Midcourse Space Experiment (MSX)
mission.
One of the main targets for MSX and a fascinating target for 2MASS is the
Galactic Center. This image is a composite of 2MASS J (blue),
Ks (green), and MSX Band A (6 - 11 µm; red)
imaging of this region (the 2MASS image mosaic has been binned to
2´´ × 2´´ pixels).
The Galactic plane runs horizontally along the image, and
the Galactic center is the bright (yellow) object near the middle. The
infrared can peer through the dense obscuring dust that hides the Galactic
center in the optical. The near-infrared is sensitive to the photospheric
emission from the very large number of, particularly cooler, stars seen toward
this region, and also gives us a glimpse of the mass of stars and gas that
comprise the very center of the Milky Way. The mid-infrared is ideal for
measuring the thermal emission from the cool dust in nebular ionized (H II)
regions and molecular clouds, producing the extended clumpy and filamentary
emission surrounding the center. Although MSX Band A is still sensitive to
stellar emission, the cool extended emission becomes apparent, relative to the
2MASS bands, and the Galactic center becomes more obvious. Even with the
penetrating power of these infrared wavelengths, however, large ``holes'' can
be seen throughout the image, where no emission in any of these bands can
emerge from objects behind the dark dust.
2MASS Image mosaic and 2MASS-MSX image combination by E. Kopan (IPAC).
Featured as an
Astronomy Picture of the Day!
(Field size 2° [galactic latitude] × 5° [galactic longitude].
Image size 10.5 Mb! For the full-resolution
11.6-Mb version of this image, click here.)
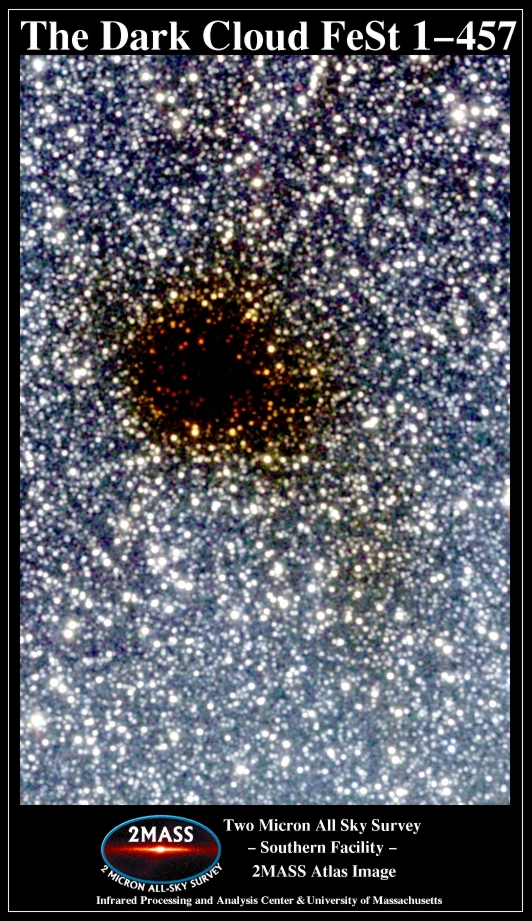 Is it the Black Hole of Calcutta? No, it's a dark, obscuring cloud of dust
near the Galactic Plane (the cloud is at RA=17h35m46.84s Dec=-25d33m10.8s,
J2000; in galactic coordinates, l=1.62, b=+3.77).
The cloud is the entry ``1-457'' in the catalog by Feitzinger & Stuwe
(1984, A&AS, 58, 365) of dark nebulae, hence, the SIMBAD designation
Fest 1-457. Based on the (J-H, H-Ks)
color-color diagram, we
estimate that the extinction toward the center of the cloud is
AV>20 mag. (Field size 8.2´ × 12.5´.
Image size 424 kb.)
Is it the Black Hole of Calcutta? No, it's a dark, obscuring cloud of dust
near the Galactic Plane (the cloud is at RA=17h35m46.84s Dec=-25d33m10.8s,
J2000; in galactic coordinates, l=1.62, b=+3.77).
The cloud is the entry ``1-457'' in the catalog by Feitzinger & Stuwe
(1984, A&AS, 58, 365) of dark nebulae, hence, the SIMBAD designation
Fest 1-457. Based on the (J-H, H-Ks)
color-color diagram, we
estimate that the extinction toward the center of the cloud is
AV>20 mag. (Field size 8.2´ × 12.5´.
Image size 424 kb.)
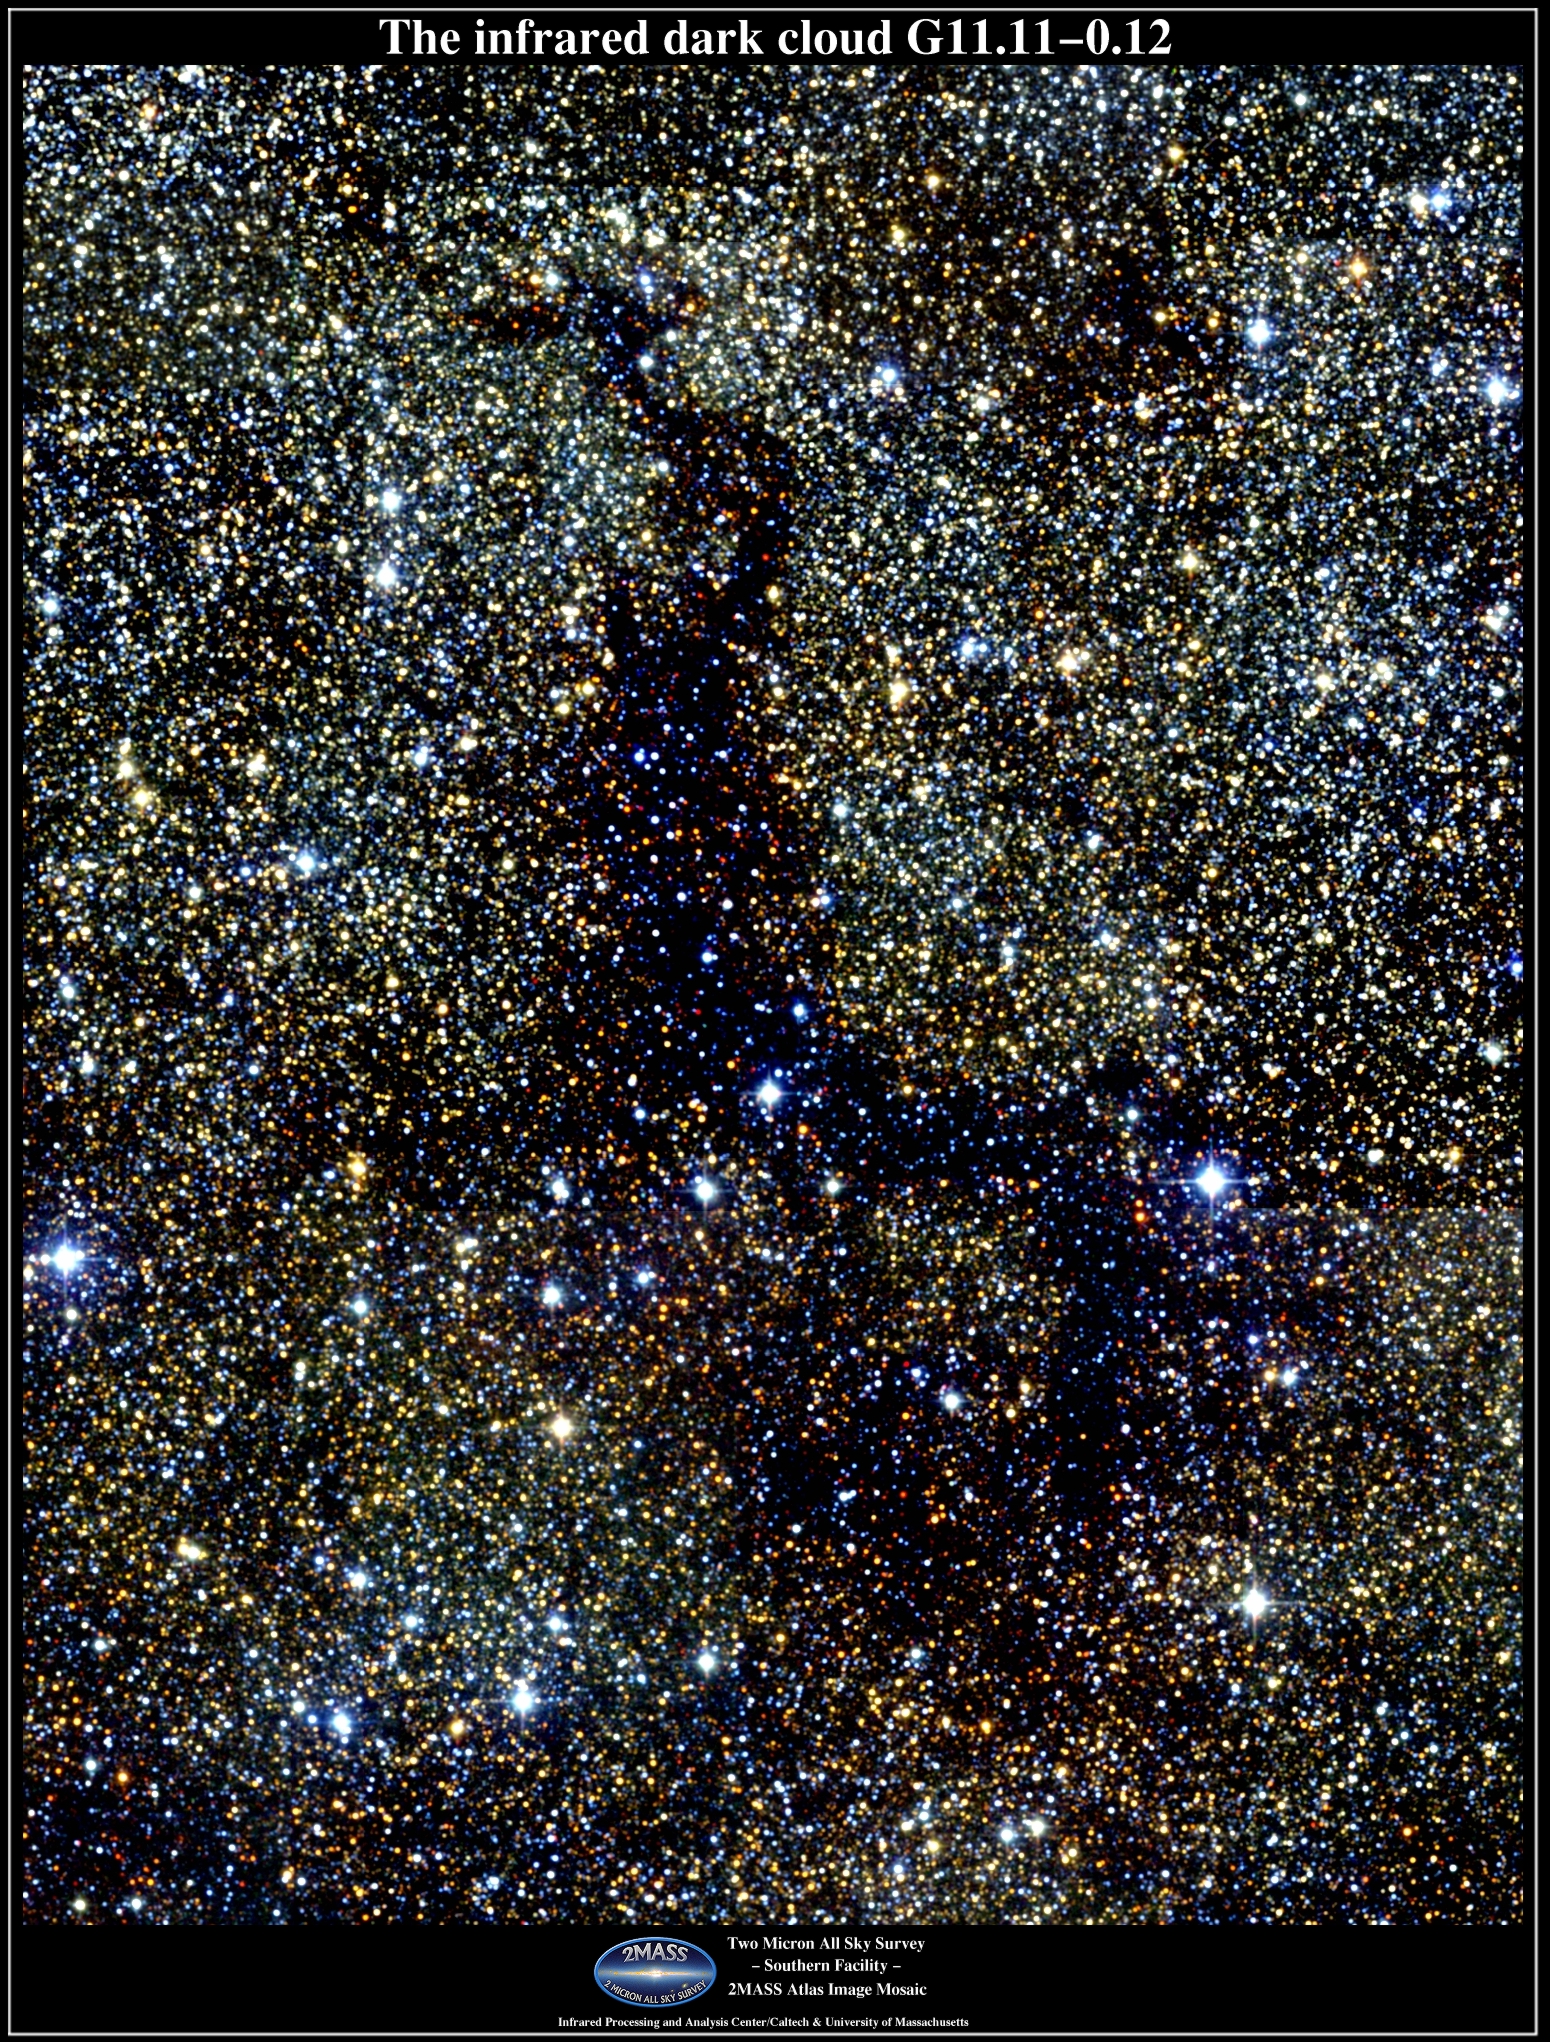 Atlas Image mosaic of the filamentary, or snake-like, infrared dark cloud
G11.11-0.12. This is an example of various
regions in the Milky Way Galaxy with very high visual extinction, in excess of
25 magnitudes. They were discovered by routine survey observations of the
Galactic plane by the
Infrared Space Observatory and the
Midcourse Space
Experiment. From the lack of emission
between 8 and 100 μm and high mid-infrared opacities, Egan et al. (1998,
ApJ, 494, L199) concluded that the infrared dark clouds contain cold (T<13 K)
dust and suggested that they are dense molecular cores. Carey et al. (2000,
ApJ, 543, L157) find strong submillimeter bright, compact sources in eight
dark clouds, using
SCUBA at the
JCMT, and these
authors suggest that these
highly embedded sources are potentially the sites for very early star
formation in the Galaxy. These
clouds, of course, look very dark on the near-infrared 2MASS images.
Image mosaic by S. Van Dyk (IPAC). These data are included in the Second
Incremental Data Release!
(Field size 25´ × 31´. Image size 3.0 Mb!)
Atlas Image mosaic of the filamentary, or snake-like, infrared dark cloud
G11.11-0.12. This is an example of various
regions in the Milky Way Galaxy with very high visual extinction, in excess of
25 magnitudes. They were discovered by routine survey observations of the
Galactic plane by the
Infrared Space Observatory and the
Midcourse Space
Experiment. From the lack of emission
between 8 and 100 μm and high mid-infrared opacities, Egan et al. (1998,
ApJ, 494, L199) concluded that the infrared dark clouds contain cold (T<13 K)
dust and suggested that they are dense molecular cores. Carey et al. (2000,
ApJ, 543, L157) find strong submillimeter bright, compact sources in eight
dark clouds, using
SCUBA at the
JCMT, and these
authors suggest that these
highly embedded sources are potentially the sites for very early star
formation in the Galaxy. These
clouds, of course, look very dark on the near-infrared 2MASS images.
Image mosaic by S. Van Dyk (IPAC). These data are included in the Second
Incremental Data Release!
(Field size 25´ × 31´. Image size 3.0 Mb!)
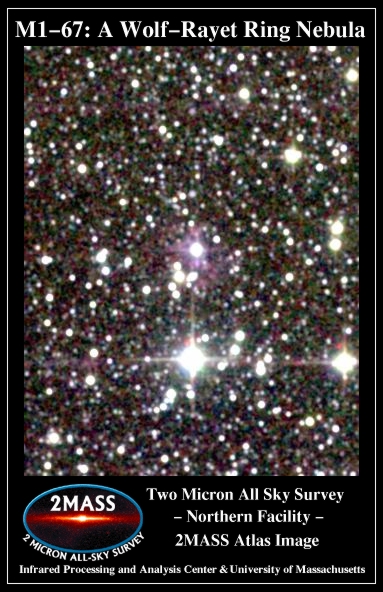 The Wolf-Rayet ring nebula M1-67. Several Wolf-Rayet (W-R) stars,
which represent the final evolutionary stages
of very massive stars, have surrounding them thick shells of matter called
"ring nebulae." The W-R star 124 (van der Hucht et al. 1981, SpSciRev, 28,
227) has a relatively
young ejection nebula (M1-67). In this 2MASS image, the bright
Ks-band emission seen around the bright W-R star (near the center
of the image) is likely to be molecular H2. The molecular gas
excitation is due to either ultraviolet flourescence, as photons from the
star are intercepted by the ring, or to shocks interacting with surrounding
gas. The nebula was recently imaged in H-alpha by the Hubble Space Telescope
(Grosdidier et al. 1998, ApJ, 506, L127). Grosdidier et al. find unprecented
structure never seen before, including what appear to be hot, dense clumps in
the wind coming from the star. (Field size 5.6´ × 7.2´.
Image size 179 kb.)
The Wolf-Rayet ring nebula M1-67. Several Wolf-Rayet (W-R) stars,
which represent the final evolutionary stages
of very massive stars, have surrounding them thick shells of matter called
"ring nebulae." The W-R star 124 (van der Hucht et al. 1981, SpSciRev, 28,
227) has a relatively
young ejection nebula (M1-67). In this 2MASS image, the bright
Ks-band emission seen around the bright W-R star (near the center
of the image) is likely to be molecular H2. The molecular gas
excitation is due to either ultraviolet flourescence, as photons from the
star are intercepted by the ring, or to shocks interacting with surrounding
gas. The nebula was recently imaged in H-alpha by the Hubble Space Telescope
(Grosdidier et al. 1998, ApJ, 506, L127). Grosdidier et al. find unprecented
structure never seen before, including what appear to be hot, dense clumps in
the wind coming from the star. (Field size 5.6´ × 7.2´.
Image size 179 kb.)
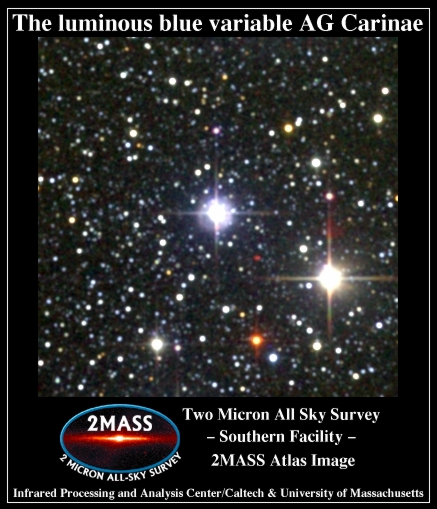 Atlas Image of the star AG Carinae.
This star is one of the prototypical luminous blue variable stars, or LBVs,
which are massive, evolved supergiant stars, in life-ending transition from an
O star, with a mass
Atlas Image of the star AG Carinae.
This star is one of the prototypical luminous blue variable stars, or LBVs,
which are massive, evolved supergiant stars, in life-ending transition from an
O star, with a mass
 40 solar masses, to a Wolf-Rayet star.
AG Car, at a distance of 6 kpc (19560 light years), has over
1 million times the luminosity of the Sun, and changes in spectral type from
early A to late O; the star has varied greatly in luminosity over the last
two decades. More importantly, it shows a dusty circumstellar nebula, visible
in the 2MASS image as the blue ring around the star.
Smith et al. (1997, MNRAS, 290, 265), from a compositional study of the nebula,
conclude that AG Car probably experienced an earlier, brief red supergiant
phase, when it ejected its hydrogen-rich outer layers to form the
~1 pc-diameter ring nebula; the ring matter has subsequently been swept up by
the present hot supergiant wind.
(The purplish "star" to the north of AG Car's diffraction spike is a known
persistence artifact; a similar red artifact can be seen to the north of
the very red star, which is to the southwest of AG Car.)
(Field size 6.0´ × 6.0´.
Image size 154 kb.)
40 solar masses, to a Wolf-Rayet star.
AG Car, at a distance of 6 kpc (19560 light years), has over
1 million times the luminosity of the Sun, and changes in spectral type from
early A to late O; the star has varied greatly in luminosity over the last
two decades. More importantly, it shows a dusty circumstellar nebula, visible
in the 2MASS image as the blue ring around the star.
Smith et al. (1997, MNRAS, 290, 265), from a compositional study of the nebula,
conclude that AG Car probably experienced an earlier, brief red supergiant
phase, when it ejected its hydrogen-rich outer layers to form the
~1 pc-diameter ring nebula; the ring matter has subsequently been swept up by
the present hot supergiant wind.
(The purplish "star" to the north of AG Car's diffraction spike is a known
persistence artifact; a similar red artifact can be seen to the north of
the very red star, which is to the southwest of AG Car.)
(Field size 6.0´ × 6.0´.
Image size 154 kb.)
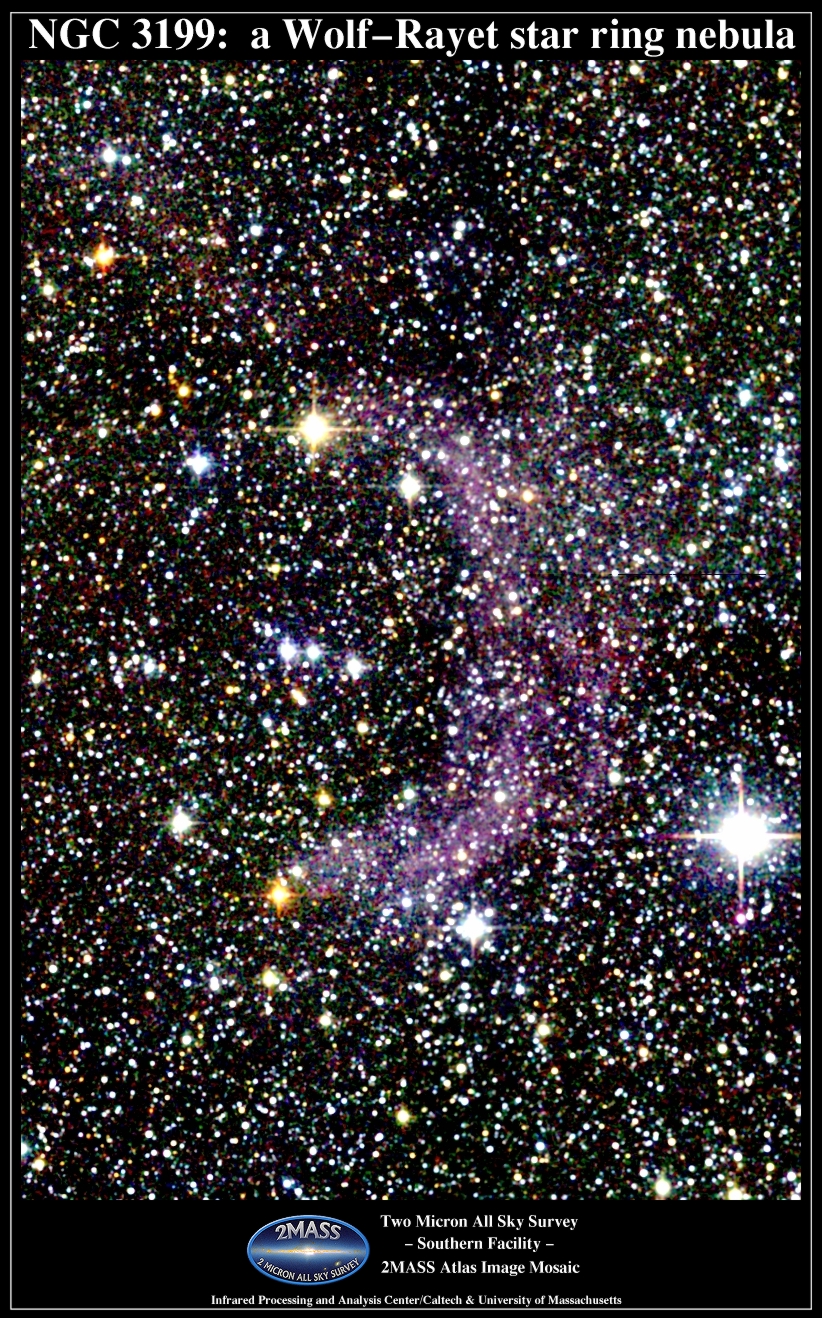 Atlas Image mosaic of NGC 3199, in the constellation Carina, which is
the wind-blown partial "ring" around the Wolf-Rayet (W-R) star WR 18 (aka HD
89358), the easternmost (leftmost) of the three bright blue stars near the
center of the 2MASS image. NGC 3199 and WR 18 are at a distance of about 3.6
kpc (11,736 light years) from us. W-R stars represent the final evolutionary
stages of very massive stars (with ~30 solar masses or greater). The nebula
shows an asymmetric appearance, i.e., only one side (the western one) of the
shell is bright, both in the optical and the near-infrared. The fainter,
eastern side is there, but is much fainter. Some W-R ring nebulae can
be seen in 2MASS images, such as the more complete ring around M1-67. But, NGC 3199 is particularly bright in the
2MASS data. Dyson & Ghanbari (1989, A&A, 226, 270) provided an explanation
for the ring's appearance through a model where a moving WR 18 is blowing a
strong stellar wind into a surrounding uniform interstellar medium. Vigorous
mass loss of 10-5 to 10-4 solar masses per year is
characteristic of W-R stars, as the star approaches the end of its short life,
although not all are surrounded by ring nebulae. Image mosaic by S. Van Dyk
(IPAC). (Field size 13´ × 19´. Image size 1.1 Mb!)
Atlas Image mosaic of NGC 3199, in the constellation Carina, which is
the wind-blown partial "ring" around the Wolf-Rayet (W-R) star WR 18 (aka HD
89358), the easternmost (leftmost) of the three bright blue stars near the
center of the 2MASS image. NGC 3199 and WR 18 are at a distance of about 3.6
kpc (11,736 light years) from us. W-R stars represent the final evolutionary
stages of very massive stars (with ~30 solar masses or greater). The nebula
shows an asymmetric appearance, i.e., only one side (the western one) of the
shell is bright, both in the optical and the near-infrared. The fainter,
eastern side is there, but is much fainter. Some W-R ring nebulae can
be seen in 2MASS images, such as the more complete ring around M1-67. But, NGC 3199 is particularly bright in the
2MASS data. Dyson & Ghanbari (1989, A&A, 226, 270) provided an explanation
for the ring's appearance through a model where a moving WR 18 is blowing a
strong stellar wind into a surrounding uniform interstellar medium. Vigorous
mass loss of 10-5 to 10-4 solar masses per year is
characteristic of W-R stars, as the star approaches the end of its short life,
although not all are surrounded by ring nebulae. Image mosaic by S. Van Dyk
(IPAC). (Field size 13´ × 19´. Image size 1.1 Mb!)
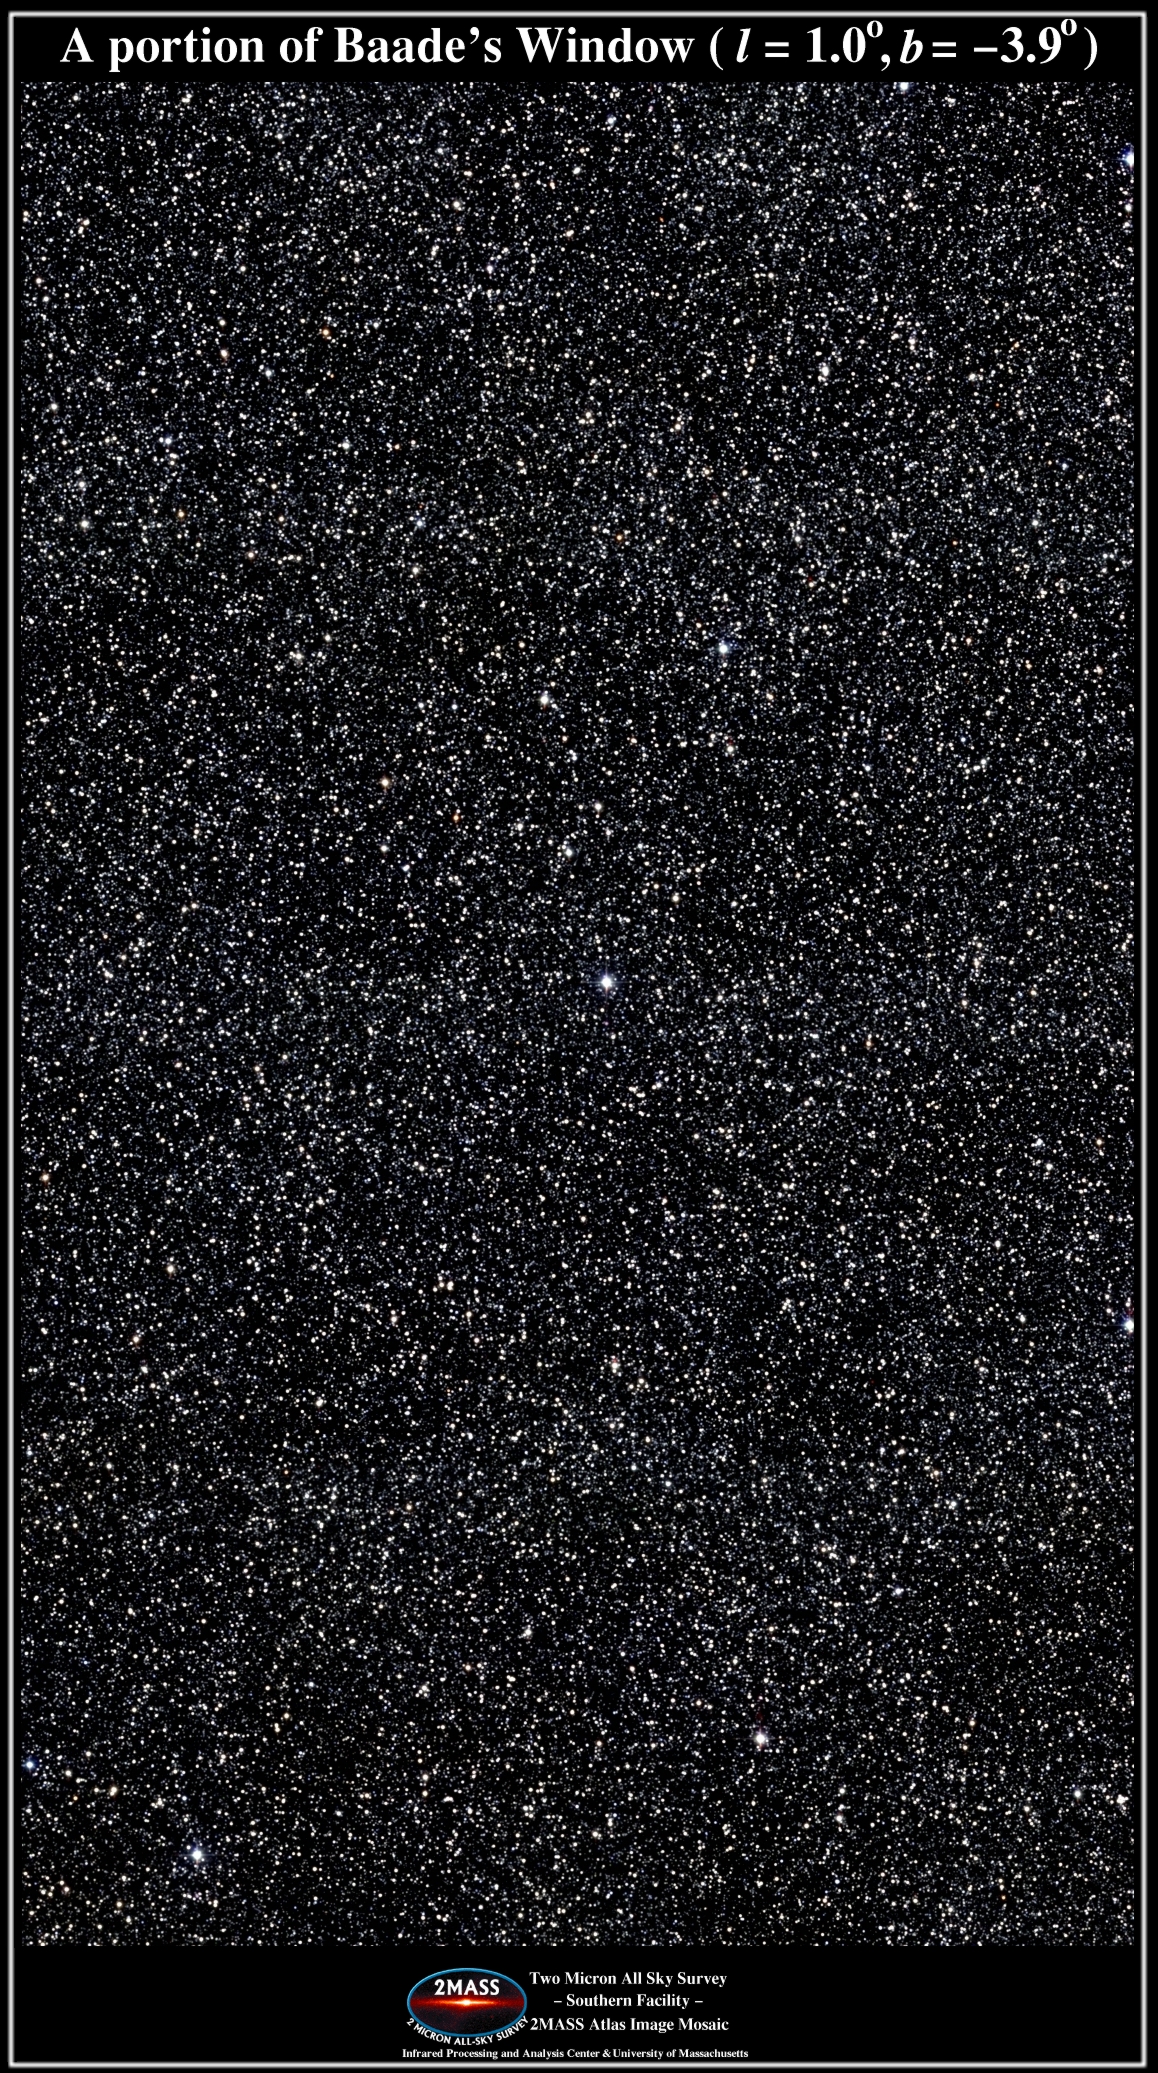 Atlas Image mosaic of a portion of Baade's Window
centered at about l=1.0°, b=-3.9°. (The downloadable
image mosaic has been shrunk by 50%, but is still 2.2 Mb in size.)
This "window" through our Milky Way
Galaxy, discovered by the German-American astronomer Walter Baade early in
the last century, is an important region of the sky, because the interstellar
extinction, due to intervening dust in the Galactic plane, is substantially
lower than other regions of the Galaxy nearby to it. Stanek (1996, ApJ, 460,
L37) estimates from optical data that the extinction ranges from 1.26 to 2.79
visual magnitudes. As a result, this window allows astronomers to more easily
view and study stars in the Galactic bulge. The chemical composition, ages,
masses, and kinematics of these stars can be determined, the distance to the
Galactic center can be measured, microlensing events can be discovered and
analyzed, and the presence of a stellar bar in the bulge can be inferred, all
important aspects to understanding the nature of the Milky Way. The 2MASS
near-infrared color-color diagram and
color-magnitude diagram for the stars within
1° of (l,b)=(1.0,-3.9) also demonstrate the relatively low
extinction for the stellar populations in a region at this general position in
the Galaxy. (Shown on the color-color diagram are the Bessell & Brett 1988,
PASP, 100, 1134, and Koorneef 1983, A&A, 128, 84, tracks for dwarf and giant
stars, as well as the reddening vector from Rieke & Lebofsky 1985, ApJ, 288,
618). Image mosaic by S. Van Dyk (IPAC).
These data are included in the Second Incremental Release!
(Field size 0.64° × 1.15°.
Image size 2.2 Mb!)
Atlas Image mosaic of a portion of Baade's Window
centered at about l=1.0°, b=-3.9°. (The downloadable
image mosaic has been shrunk by 50%, but is still 2.2 Mb in size.)
This "window" through our Milky Way
Galaxy, discovered by the German-American astronomer Walter Baade early in
the last century, is an important region of the sky, because the interstellar
extinction, due to intervening dust in the Galactic plane, is substantially
lower than other regions of the Galaxy nearby to it. Stanek (1996, ApJ, 460,
L37) estimates from optical data that the extinction ranges from 1.26 to 2.79
visual magnitudes. As a result, this window allows astronomers to more easily
view and study stars in the Galactic bulge. The chemical composition, ages,
masses, and kinematics of these stars can be determined, the distance to the
Galactic center can be measured, microlensing events can be discovered and
analyzed, and the presence of a stellar bar in the bulge can be inferred, all
important aspects to understanding the nature of the Milky Way. The 2MASS
near-infrared color-color diagram and
color-magnitude diagram for the stars within
1° of (l,b)=(1.0,-3.9) also demonstrate the relatively low
extinction for the stellar populations in a region at this general position in
the Galaxy. (Shown on the color-color diagram are the Bessell & Brett 1988,
PASP, 100, 1134, and Koorneef 1983, A&A, 128, 84, tracks for dwarf and giant
stars, as well as the reddening vector from Rieke & Lebofsky 1985, ApJ, 288,
618). Image mosaic by S. Van Dyk (IPAC).
These data are included in the Second Incremental Release!
(Field size 0.64° × 1.15°.
Image size 2.2 Mb!)
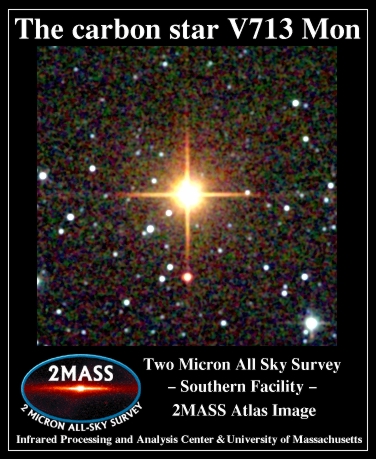 Atlas Image of the carbon star V713 Monocerotis.
This star, also known as
AFGL 935 and IRAS 06230-0930, is an example of asymptotic giant branch (AGB)
stars which are surrounded by an expanding shell. The AGB stars have evolved
from main sequence stars in the mass range 1.2-1.6 solar masses (Claussen et
al. 1987), but a significant population come from 2.5-4 solar mass main
sequence stars (Barnbaum, Kastner, & Zuckerman 1991, AJ, 102, 289).
The bright red color of the star in the 2MASS image indicates a general
infrared excess due to carbon-rich dust formation in the shell. (The fainter
red "star" to the south is a latent image artifact, produced by the mode of the
survey scanning; diffraction spike artifacts are also seen in the image.)
The dust is subject to pressure from the star's radiation and is dragged
outward with the atmospheric gas, and is the cause for the mass loss from the
star. The evolved star experiences pulsations and is variable with a long
period; the variability and the amount of mass loss appears correlated for the
carbon stars. Although the dust formation mechanism is not known, it appears
that the dust is induced by the stellar pulsations. LeBertre (1997, A&A, 324,
1059) finds that the infrared colors of carbon stars shed light on the
processes of dust formation and mass loss. V713 Mon, at a distance of 2240
pc (from its 494-day pulsation period), has a shell expansion velocity of 13.7
km s-1 and a mass-loss rate of 2.8×10⁻⁶ solar
masses per year. LeBertre finds a correlation between the mass-loss rate for
this and other carbon stars and the stars' near-infrared colors. 2MASS is
particularly well-suited for not only finding many carbon stars throughout the
Galaxy, but can also assist in characterizing the nature of their evolution.
(Field size 5.0´ × 5.0´.
Image size 139 kb.)
Atlas Image of the carbon star V713 Monocerotis.
This star, also known as
AFGL 935 and IRAS 06230-0930, is an example of asymptotic giant branch (AGB)
stars which are surrounded by an expanding shell. The AGB stars have evolved
from main sequence stars in the mass range 1.2-1.6 solar masses (Claussen et
al. 1987), but a significant population come from 2.5-4 solar mass main
sequence stars (Barnbaum, Kastner, & Zuckerman 1991, AJ, 102, 289).
The bright red color of the star in the 2MASS image indicates a general
infrared excess due to carbon-rich dust formation in the shell. (The fainter
red "star" to the south is a latent image artifact, produced by the mode of the
survey scanning; diffraction spike artifacts are also seen in the image.)
The dust is subject to pressure from the star's radiation and is dragged
outward with the atmospheric gas, and is the cause for the mass loss from the
star. The evolved star experiences pulsations and is variable with a long
period; the variability and the amount of mass loss appears correlated for the
carbon stars. Although the dust formation mechanism is not known, it appears
that the dust is induced by the stellar pulsations. LeBertre (1997, A&A, 324,
1059) finds that the infrared colors of carbon stars shed light on the
processes of dust formation and mass loss. V713 Mon, at a distance of 2240
pc (from its 494-day pulsation period), has a shell expansion velocity of 13.7
km s-1 and a mass-loss rate of 2.8×10⁻⁶ solar
masses per year. LeBertre finds a correlation between the mass-loss rate for
this and other carbon stars and the stars' near-infrared colors. 2MASS is
particularly well-suited for not only finding many carbon stars throughout the
Galaxy, but can also assist in characterizing the nature of their evolution.
(Field size 5.0´ × 5.0´.
Image size 139 kb.)
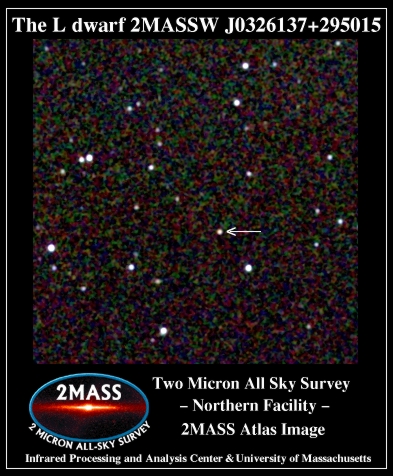 The L dwarf 2MASSW J0326137+295015.
(Field size 5.4´ × 5.4´.
Image size 152 kb.)
The L dwarf 2MASSW J0326137+295015.
(Field size 5.4´ × 5.4´.
Image size 152 kb.)
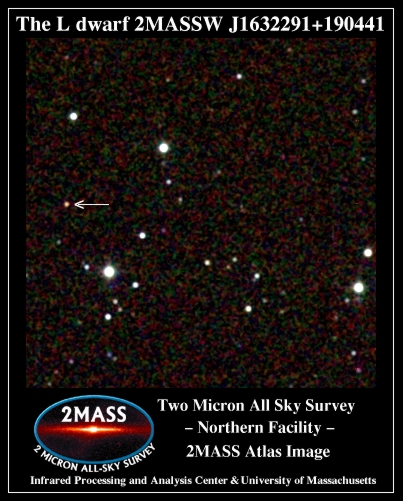 The L dwarf 2MASSW J1632291+190441.
(Field size 5.8´ × 5.8´.
Image size 161 kb.)
The L dwarf 2MASSW J1632291+190441.
(Field size 5.8´ × 5.8´.
Image size 161 kb.)
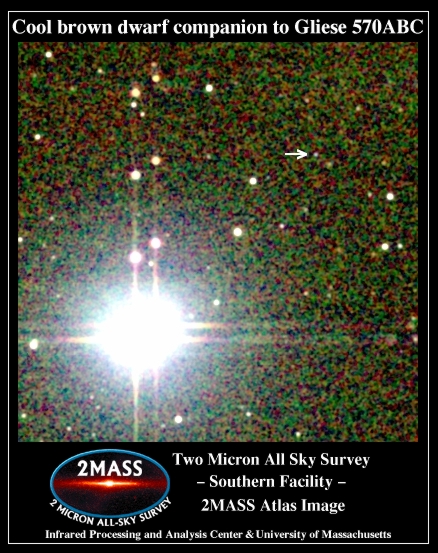 Atlas Image mosaic of the T-type methane brown dwarf,
Gliese 570D (Gl 570D), companion to the Gl 570ABC triple star system.
Gl 570D is widely separated from the main system and is indicated with an
arrow. Its brightness is overwhelmed by Gl 570ABC, seen as the two bright
stars in the 2MASS image (the Gl 570BC binary system is unresolved in the
image). T dwarfs are so cool that the methane in the object's atmosphere
dominates the absorption spectrum, which peaks in the near-infrared. The
strong methane absorption, particularly at 2 µm, results in less light
in the Ks band, relative to J and H, such that the dwarfs
look quite blue in the near-infrared. Their appearance is very similar to
the methane-rich gas planets in our own solar system,
Uranus
and Neptune. Their color and relative faintness make them distinct in
the 2MASS database. What makes Gl 570D so particularly interesting is that
it is significantly cooler and less luminous than any other known brown dwarf,
including the prototype T dwarf, Gl 229B. Burgasser et al. (2000, ApJ, 531,
L57) find that temperature and luminosity of Gl 570D is 750 K and
2.8 × 10⁻⁶ the luminosity of the Sun, respectively,
and they infer a mass for the brown dwarf of ~50 Jupiter masses.
(Field size 6.7´ × 6.7´. Image size 214 kb.)
Atlas Image mosaic of the T-type methane brown dwarf,
Gliese 570D (Gl 570D), companion to the Gl 570ABC triple star system.
Gl 570D is widely separated from the main system and is indicated with an
arrow. Its brightness is overwhelmed by Gl 570ABC, seen as the two bright
stars in the 2MASS image (the Gl 570BC binary system is unresolved in the
image). T dwarfs are so cool that the methane in the object's atmosphere
dominates the absorption spectrum, which peaks in the near-infrared. The
strong methane absorption, particularly at 2 µm, results in less light
in the Ks band, relative to J and H, such that the dwarfs
look quite blue in the near-infrared. Their appearance is very similar to
the methane-rich gas planets in our own solar system,
Uranus
and Neptune. Their color and relative faintness make them distinct in
the 2MASS database. What makes Gl 570D so particularly interesting is that
it is significantly cooler and less luminous than any other known brown dwarf,
including the prototype T dwarf, Gl 229B. Burgasser et al. (2000, ApJ, 531,
L57) find that temperature and luminosity of Gl 570D is 750 K and
2.8 × 10⁻⁶ the luminosity of the Sun, respectively,
and they infer a mass for the brown dwarf of ~50 Jupiter masses.
(Field size 6.7´ × 6.7´. Image size 214 kb.)
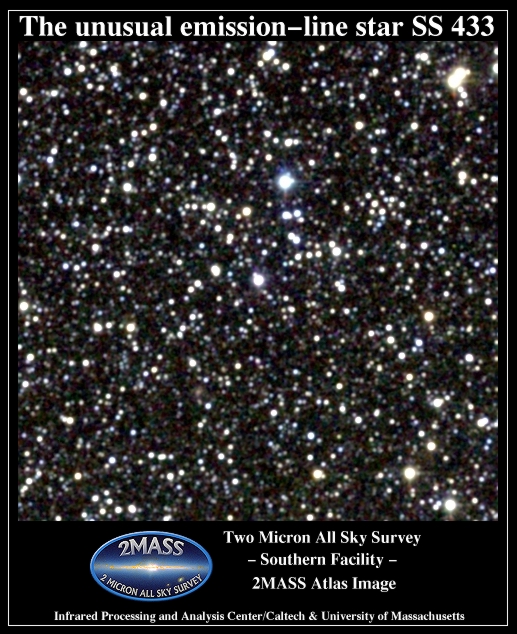 Atlas Image, covering 8´ × 8´ on the sky of SS 433 and
its environs.
The 433rd entry in the Stephenson-Sanduleak (1977, ApJS, 33, 459) catalog of
H
Atlas Image, covering 8´ × 8´ on the sky of SS 433 and
its environs.
The 433rd entry in the Stephenson-Sanduleak (1977, ApJS, 33, 459) catalog of
H emission stars in the Milky Way, aka V1343 Aquilae, is
one of the most peculiar and possibly unique objects in the Galaxy (it is seen
as the relatively bright star at the center of the 2MASS image). The
strong emission lines seen in the spectrum of SS 433 appear as two sets which
alternately redshift and blueshift in a smooth and regular fashion. The line
sets, when redshifted, reach an impressive maximum of 50,000 km s-1,
while the sets, when blueshifted, reach a maximum of 30,000 km s-1.
These velocities both are a significant fraction of the speed of light! The
basic model hypothesizes that the emission arises from two opposing collimated
jets of matter, which rotate once every 164 days. The jets emanate from an
accretion disk around a neutron star in an interacting binary system, possibly
with a B-type companion star. That the compact object is likely a neutron star
is consistent with the likely association of SS 433 with the supernova remnant
W50; the jets interact with the nebula (Dubner et al. 1998, AJ, 116, 1842).
SS 433, on the date that the routine 2MASS southern operations observed
it (1999 Aug 11 UT), had magnitudes J=9.40, H=8.75, Ks=8.18.
Kodaira, Nakada, & Backman (1985, ApJ, 296, 232) found the near-infrared
emission to be, not unexpectedly, variable and likely mostly arising from the
disk. The 2MASS color-color and
color-magnitude diagrams (SS 433 is the red star
on the latter diagram) indicate that the
recent radio distance (Dubner et al.) of ~3.0 kpc (9780 light years) and a
visual extinction of 8 to 9 magnitudes are consistent with the brightnesses
and colors of many of the stars in SS 433's environment.
(Field size 8´ × 8´. Image size 267 kb.)
emission stars in the Milky Way, aka V1343 Aquilae, is
one of the most peculiar and possibly unique objects in the Galaxy (it is seen
as the relatively bright star at the center of the 2MASS image). The
strong emission lines seen in the spectrum of SS 433 appear as two sets which
alternately redshift and blueshift in a smooth and regular fashion. The line
sets, when redshifted, reach an impressive maximum of 50,000 km s-1,
while the sets, when blueshifted, reach a maximum of 30,000 km s-1.
These velocities both are a significant fraction of the speed of light! The
basic model hypothesizes that the emission arises from two opposing collimated
jets of matter, which rotate once every 164 days. The jets emanate from an
accretion disk around a neutron star in an interacting binary system, possibly
with a B-type companion star. That the compact object is likely a neutron star
is consistent with the likely association of SS 433 with the supernova remnant
W50; the jets interact with the nebula (Dubner et al. 1998, AJ, 116, 1842).
SS 433, on the date that the routine 2MASS southern operations observed
it (1999 Aug 11 UT), had magnitudes J=9.40, H=8.75, Ks=8.18.
Kodaira, Nakada, & Backman (1985, ApJ, 296, 232) found the near-infrared
emission to be, not unexpectedly, variable and likely mostly arising from the
disk. The 2MASS color-color and
color-magnitude diagrams (SS 433 is the red star
on the latter diagram) indicate that the
recent radio distance (Dubner et al.) of ~3.0 kpc (9780 light years) and a
visual extinction of 8 to 9 magnitudes are consistent with the brightnesses
and colors of many of the stars in SS 433's environment.
(Field size 8´ × 8´. Image size 267 kb.)
Return to 2MASS Image Gallery Homepage