II. Contents of the 2MASS First Incremental Data Release
2. Point Source Catalog (PSC):
a. Point Source Catalog Format
The First Release PSC was drawn from a database of all "detections"
found in the 3391 Tiles included in the release area. This "working database"
contains approximately a factor of two more objects than are in the PSC,
and a large number are simply detections of noise. A rigorous set of
selection criteria
were applied to each source in the working database to extract a set of
catalog sources that meet the demanding requirements of the 2MASS:
The following table, and Figure 1
illustrate the distribution of sources in the First Release PSC with
galactic latitude. Note that this is not necessarily the true
distribution of near-infrared sources on the sky because
the First Release does not sample the same area at all latitudes.
Still, it is obvious that the majority of point sources will be
heavily concentrated towards the Galactic plane; 75% of the
PSC objects have |b| < 20o.
Figure 2 and
Figure 3 show the differential
J, H and Ks PSC source counts for 2°
diameter (3.1 sq. deg.) fields at high Galactic latitude field
(l=301°, b=78°) and in the Galactic plane
l=55°, b=1°), respectively. In each figure,
the blue line represent the
J-band source counts, the green line is H and the red line is Ks.
At high latitude, the 2MASS PSC contains accurate detections
well below the nominal Survey completeness limits of J=15.8, H=15.1
and Ks=14.3 mag. The turnover in the source
counts in the Galactic plane field occurs nearly 1 magnitude brighter
because of the affects of confusion noise on the detection
thresholds. The low galactic latitude source count plot also
shows a number of unphysically faint sources in each band. These measurements
are all accompanied by large uncertainties and low SNR's, and
are of correspondingly low confidence.
b. PSC Catalog Selection Criteria:
c. General Properties:

|

|
 |
| Figure 1 | Figure 2 | Figure 3 |
d. Photometric Properties:
- Photometric Precision
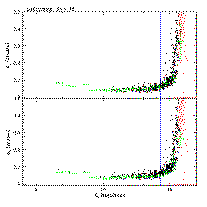
The characteristic photometric precision of measurements of unconfused sources in the 2MASS PSC is illustrated by Figure 4 which shows the photometric repeatability for point sources in the P161-D calibration field. The black crosses represent the RMS dispersion about the mean magnitude plotted versus the mean magnitude of all sources detected at least 16 out of the 18 times the field was observed during the night of 16 November 1997 UT. Red points denoted sources detected fewer than 16 out of 18 times. The green bars indicate the mean RMS averaged in 0.5-mag bins. The top panel shows data for the J-band; H-band is in the center panel; and, Ks is in the bottom panel. The horizontal blue lines indicate signal-to-noise SNR=10 levels, and the vertical blue lines indicate the Level 1 Requirement magnitudes for SNR>10. These data satisfy the requirements for photometric sensitivity and precision in all three bands.
- Band-Band Photometric Performance
Figure 5 shows the J-H-Ks Color-Color Diagram for 3,141 three-band-detected sources in a 2o diameter high Galactic latitude field at l=301o, b=78o (yellow=SNR(Ks)>40; blue=SNR(Ks)>20; black=SNR(Ks)<20); red and green lines indicate dwarf and giant tracks, respectively, from Bessell & Brett [1988, PASP, 100, 1134]; the diagonal black line indicates the reddening vector for AV=5 mags). There is no evidence for reddening in this field, and there are very few bright (high SNR) stars.
Figure 6 shows the J-H-Ks Color-Color Diagram for 190,157 three-band-detected sources in a 2o diameter low Galactic latitude Field at l=55o, b=1o (yellow=SNR(Ks)>40; blue=SNR(Ks)>20; black=SNR(Ks)<20); red and green lines indicate dwarf and giant tracks, respectively, from Bessell & Brett [1988, PASP, 100, 1134]; the diagonal black line indicates the reddening vector for AV=5 mags). There is considerable reddening of the stars in this field, plus a significant population of giant. Confusion in high source density regions contributes to the large scatter in the colors of the low SNR sources.

|

|
 |
| Figure 4 | Figure 5 | Figure 6 |
e. Astrometric Properties:
- Internal Repeatability of Reconstructed Positions
The internal RA (top) and DEC (bottom) positional repeatability of all sources in the P161-D calibration field observed on 16 November 1997 UT are shown in Figure 7 versus Ks magnitude. As in Figure 4, the black crosses denote sources detected at least 16 out of the 18 times the field was scanned, red points indicate sources detected less than 16 times, and the green bars show the average positional RMS in 0.5-mag bins. The full scale in each panel is 0.5". One can see that the internal positional consistency is outstanding.
- Reconstructed Precision of the Astrometric Reference Stars
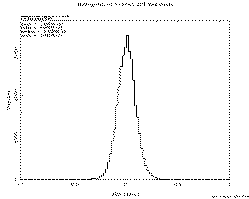
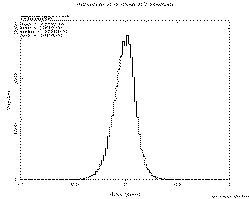
The distribution of RA and Declination residuals between the reconstructed and ACT catalog positions of the nearly 40,000 Tycho stars included in the First Release PSC are shown Figure 8 and Figure 9, respectively. The one-sigma values for each distribution are approximately 0.1".
f. Miscellaneous:
- Number of Possible Known Asteroid and Comet Detections Identified in
Catalog: 1188
The 2MASS First Release PSC contains 1186 putative detections of known minor planets and 2 comets. A number of the asteroids were detected multiple times because they fell in the overlap region between tiles, or because the moved to a region of sky covered by observations of a different tile at a different time. Some fraction of the putative detections are not valid, but are chance superpositions of the objects on background sources. For example the two comet "detections" are chance alignments with relatively bright background stars.

|

|
 |
| Figure 7 | Figure 8 | Figure 9 |
[Last Updated: 1999 May 6, by R. Cutri]
Previous page. Next page.
Return to Explanatory Supplement TOC Page.