I. Introduction
2. The 2MASS Sky
a. Stars
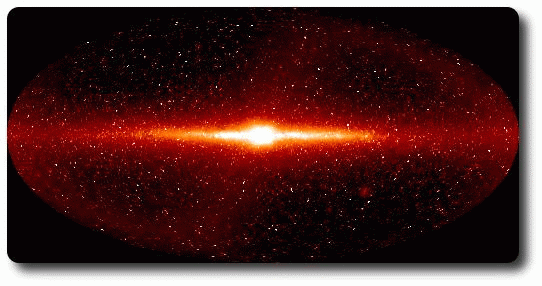
Stars dominate the 2MASS sky. The final 2MASS catalogs will contain of order 300 million stars and 1 million galaxies. As the COBE 2-micron all-sky map at right graphically illustrates, 75% of the 2MASS point sources will lie less than 10° from the galactic plane.
The frames below illustrate the two extreme 2MASS environments -- the Galactic plane and the Galactic pole -- including color-color and color-magnitude diagrams for both environments.
| Galactic Pole ( l=34o, b=81o ) | Galactic Plane ( l=54o, b=2o ) |
 |
 |
| source overlay | source overlay |
 |
 |
| Bessell & Brett overlay | Bessell & Brett overlay |
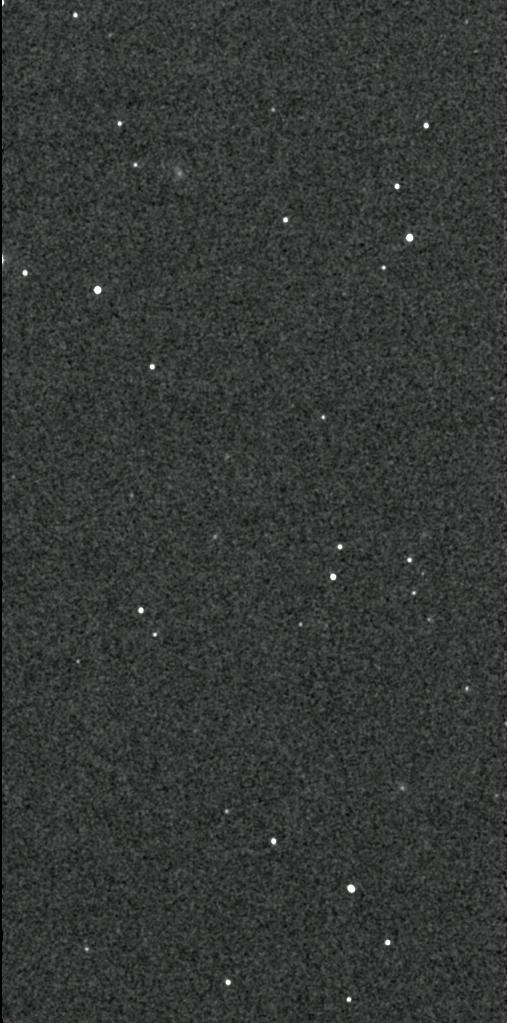
i. The Galactic Pole
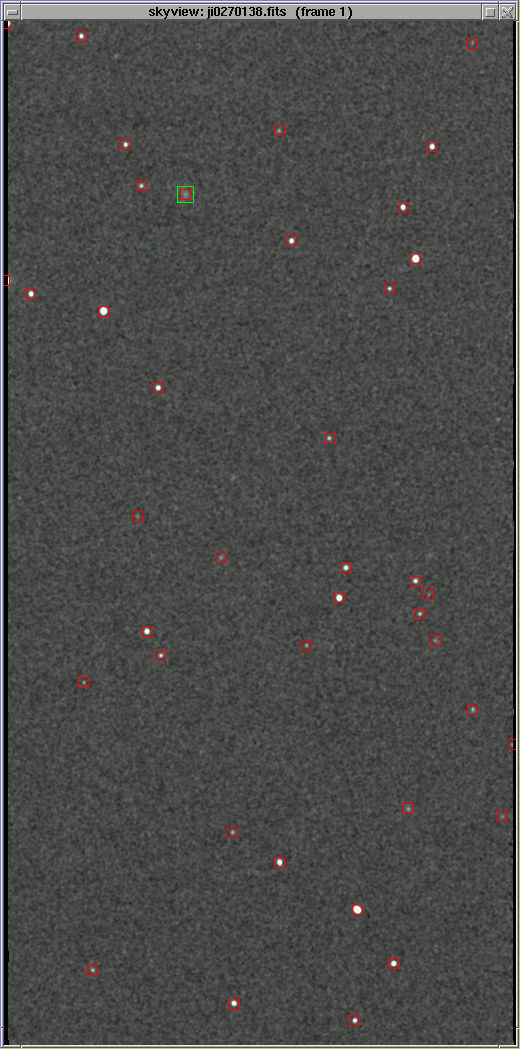
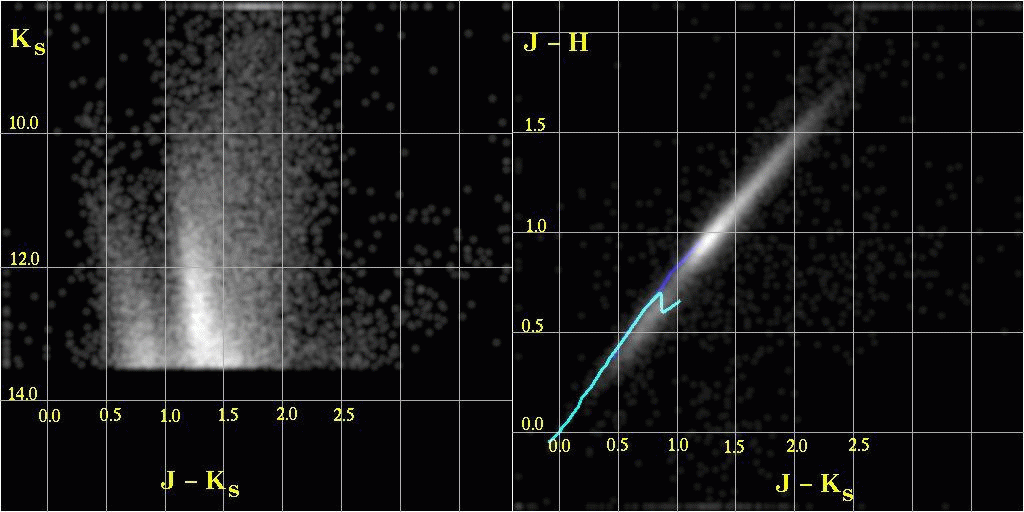
Sources sparsely populate the 2MASS high galactic latitude sky. A typical 1024´´ × 512´´ Atlas Image contains a few dozen stars and a galaxy or two. The dominance of Galactic stars at these latitudes is indicative of the depth of the Survey -- signal-to-noise ratio (SNR) = 10 is achieved at fainter than J=15.8 (0.7 mJy), H=15.1 (0.9 mJy), and Ks=14.3 (1.2 mJy). The 2MASS Point Source Catalog contains all sources extracted with a signal-to-noise ratio greater than 7 in any one band. For bright sources where the background noise is unimportant, source flux extraction uncertainties are of order 0.02-0.03 mag and positions are typically accurate to <0.2´´.
The source overlay blinks all catalog sources
from both the PSC (red) and XSC (green) in the Image Atlas frame. As
the source overlay demonstrates, extended sources trigger point source
extractions and thus appear in the point source catalog -- albeit with
large  2 indicative of their deviation from a point
spread function profile. A few faint sources apparent to the eye do
not have PSC counterparts. The point source pipeline identified and
extracted many of these sources (as well as many noise-triggered
detections), however they lie below the signal-to-noise ratio cutoff for the
current catalog. Some of the unmarked sources may also result from
the persistence afterimage induced in the arrays by bright stars
observed in previous frames. Since the positional offset to these
persistence artifacts are well established they are flagged in
processing and removed from the catalogs. Many of the unmarked
sources in the low galactic latitude source overlay are persistence artifacts from bright
stars. A green cross identifies one such artifact.
2 indicative of their deviation from a point
spread function profile. A few faint sources apparent to the eye do
not have PSC counterparts. The point source pipeline identified and
extracted many of these sources (as well as many noise-triggered
detections), however they lie below the signal-to-noise ratio cutoff for the
current catalog. Some of the unmarked sources may also result from
the persistence afterimage induced in the arrays by bright stars
observed in previous frames. Since the positional offset to these
persistence artifacts are well established they are flagged in
processing and removed from the catalogs. Many of the unmarked
sources in the low galactic latitude source overlay are persistence artifacts from bright
stars. A green cross identifies one such artifact.
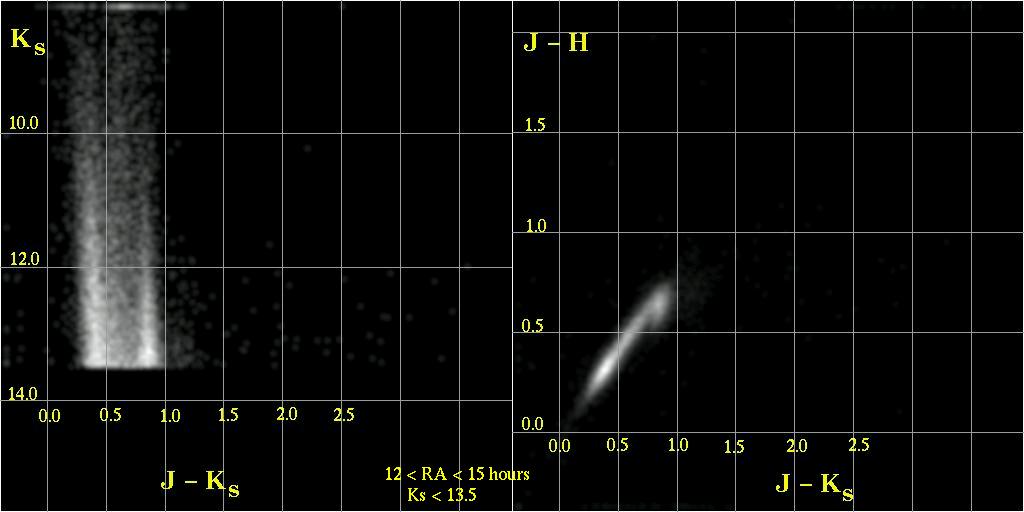
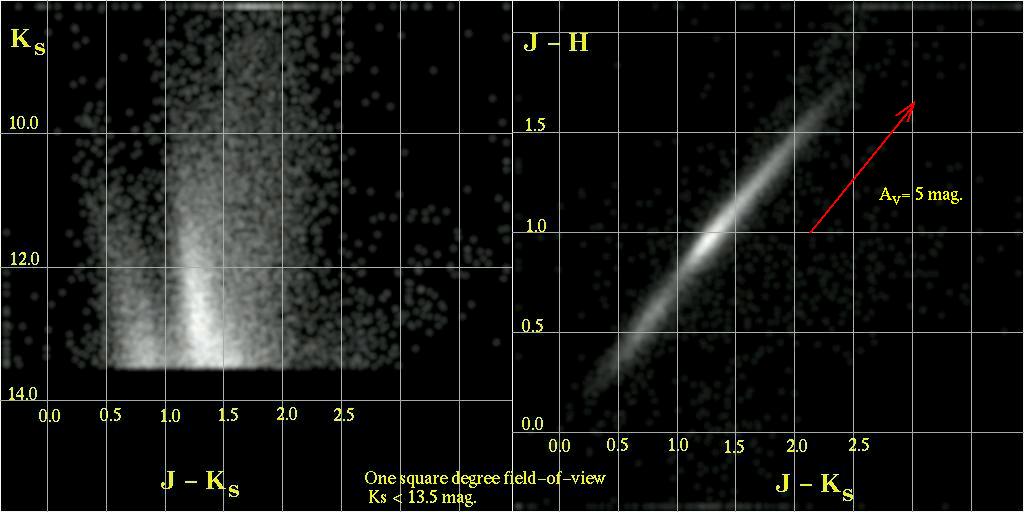
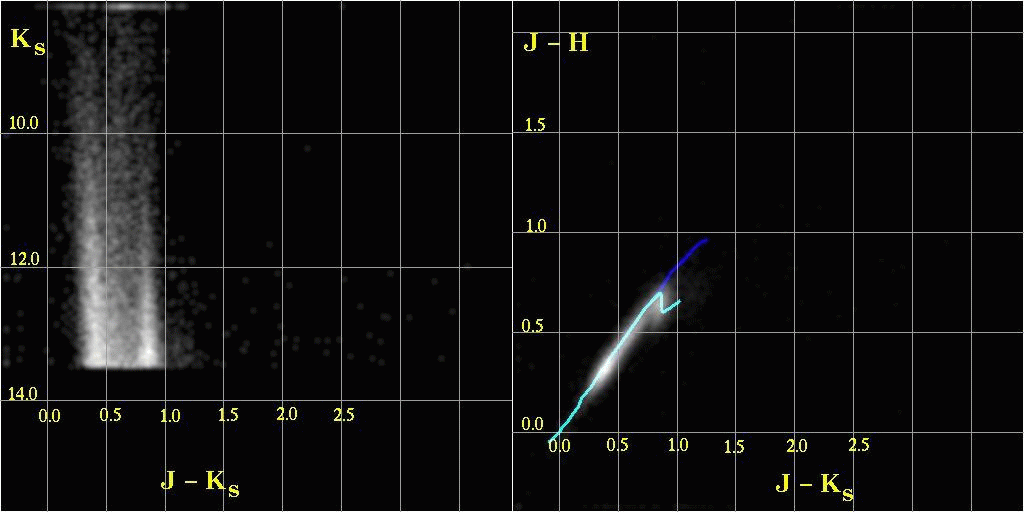
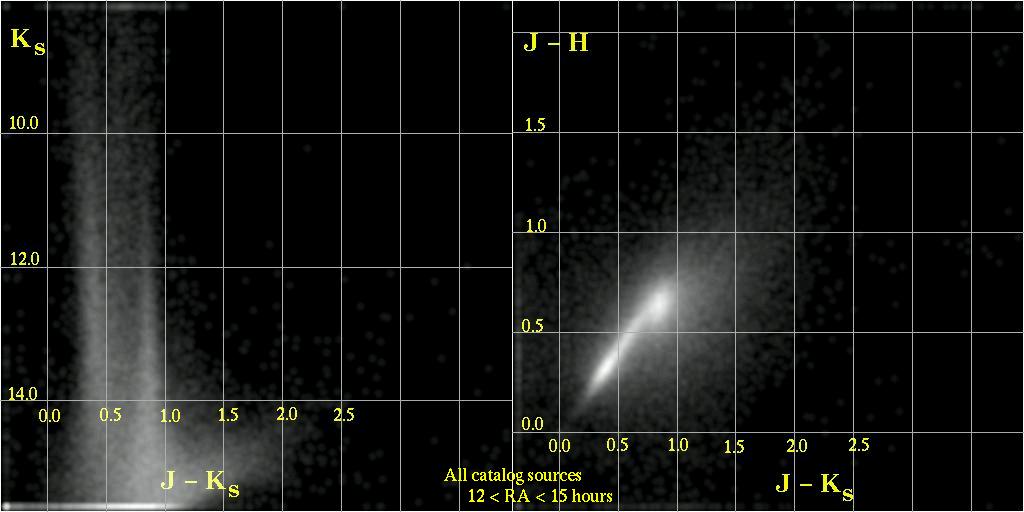
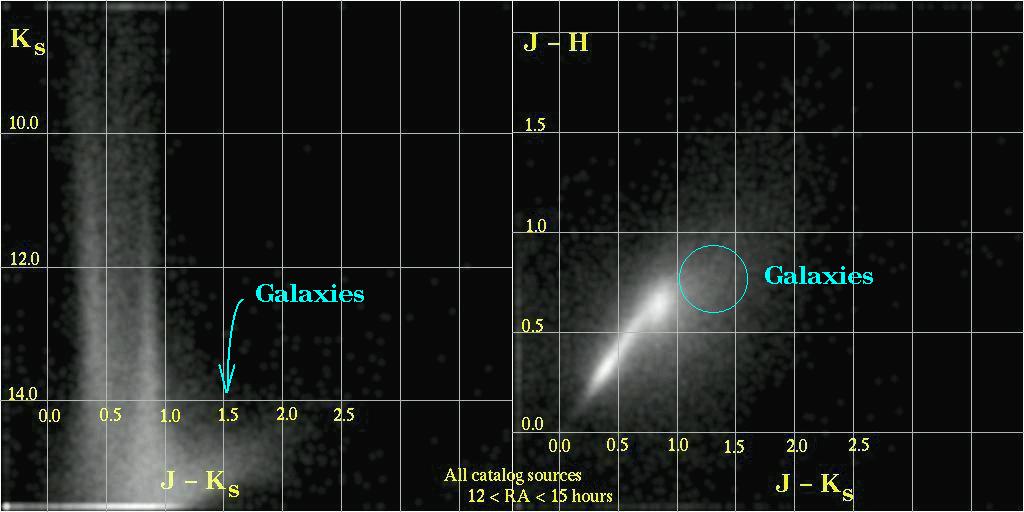
The J-H vs. J-Ks color-color and Ks vs. J-Ks diagrams underscore the precision of the photometry and delineate two stellar populations -- disk dwarfs and halo giants -- which dominate at the galactic pole. This plot includes all high signal-to-noise ratio (Ks<13.5) sources in the release catalog between RA=12 hours and 15 hours. A similar plot shows diagrams constructed from all of the sources from the same region of sky in the catalog. 2MASS reports magnitude in the natural 2MASS photometric system. By coincidence, 2MASS colors lie very close to those reported by Bessell and Brett (1988, PASP, 100, 1134). The dark blue line is the locus of giant colors. Light blue represents dwarfs.
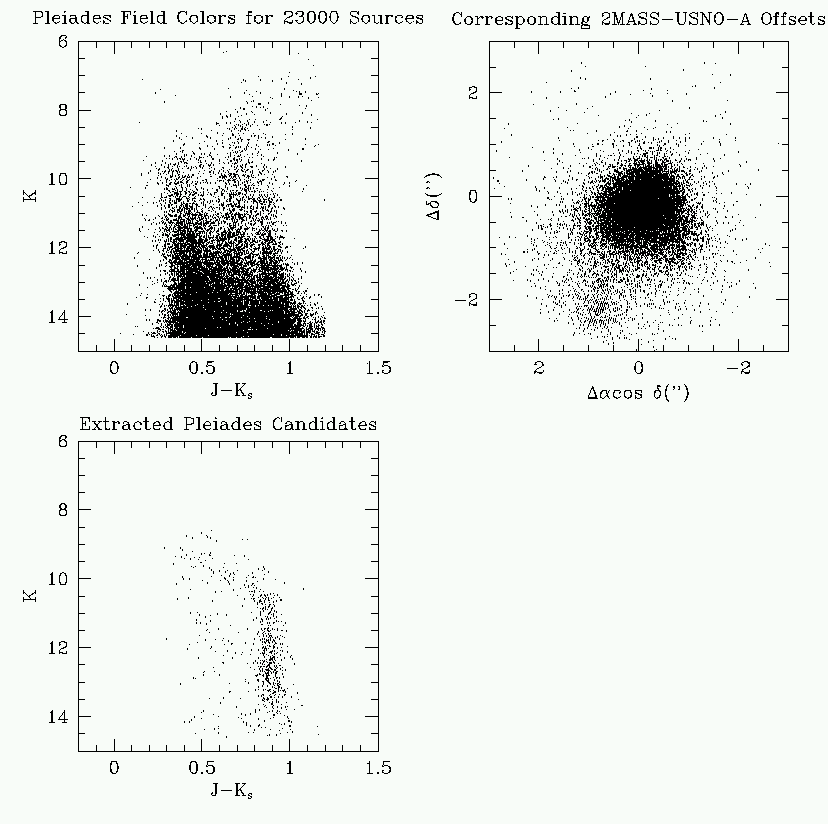 90% of all 2MASS high-latitude sources have associations
in the USNO-A digitization of the original Palomar and ESO Sky
Surveys. The 2MASS point source catalog entries include the USNO-A B and
R-band magnitudes and the 2MASS/USNO-A positional difference (in the
case of entries with Tycho catalog associations, the magnitudes included are in
the B and V bands). Since 2MASS
and USNO-A are both characterized by high astrometric accuracy, the
positional differences carry proper motion information. This plot at
right shows position differences between 2MASS and USNO-A in the
direction of the Pleiades star cluster. Pleiades members are apparent
by their offset proper motion.
90% of all 2MASS high-latitude sources have associations
in the USNO-A digitization of the original Palomar and ESO Sky
Surveys. The 2MASS point source catalog entries include the USNO-A B and
R-band magnitudes and the 2MASS/USNO-A positional difference (in the
case of entries with Tycho catalog associations, the magnitudes included are in
the B and V bands). Since 2MASS
and USNO-A are both characterized by high astrometric accuracy, the
positional differences carry proper motion information. This plot at
right shows position differences between 2MASS and USNO-A in the
direction of the Pleiades star cluster. Pleiades members are apparent
by their offset proper motion.
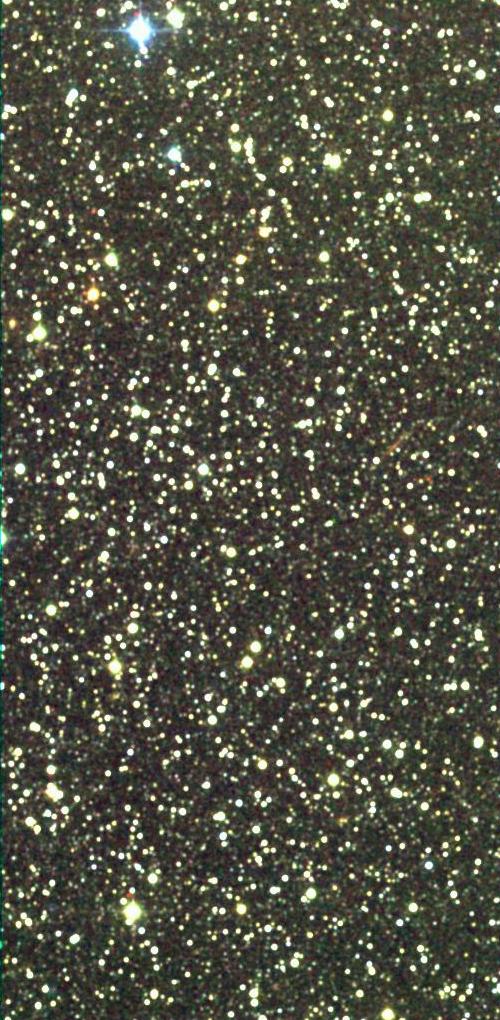
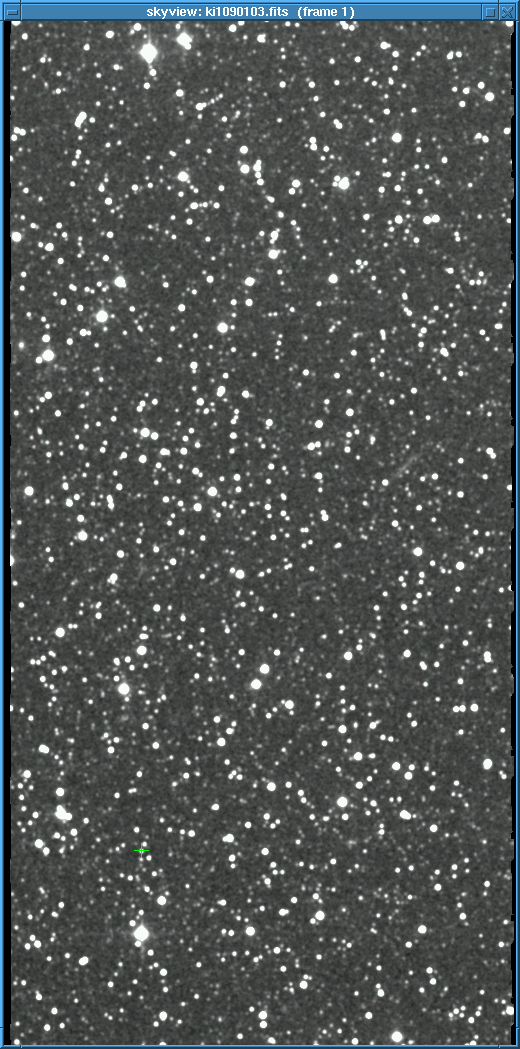
ii. The Galactic Plane
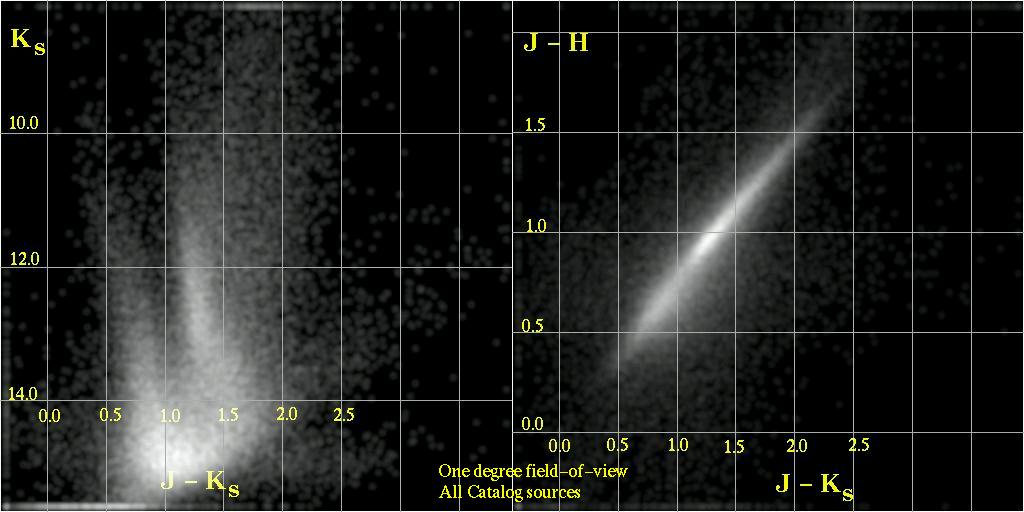
Interstellar reddening and source confusion dominate the appearance of the 2MASS sky deep within the galactic plane. The three-color Atlas Image "visually" highlights reddened stars. The plane color-color and color-magnitude diagrams quantify the effects of reddening. This color-color diagram was drawn from a 1-square-degree region centered on the Atlas Image. In the absence of extinction the color-color diagram in this direction would resemble the high-latitude distribution. Reddening smears the low-latitude distribution to the upper right relative to the main sequence and giant loci. The reddest sources in this square-degree region experience visual extinctions of between 5 and 10 magnitudes and would therefore be difficult to detect in visible wavelength surveys.
The compactness of the color-color distribution demonstrates that the source extraction software is robust for deriving photometry of brighter sources even in this dense field. The color-color diagram resulting from the inclusion of all sources in the catalog still shows a similarly well defined distribution. As source density increases the source extraction flux threshold rises and thus tracks the confusion noise. The faint source extraction limit moves to higher flux levels in dense regions. As a result, the sources extracted in dense regions tend to have good photometry, however the flux limit will not be as deep as at the galactic poles.
In addition to star counts and reddening profiles, the 2MASS galactic
plane data contains many star-forming regions.
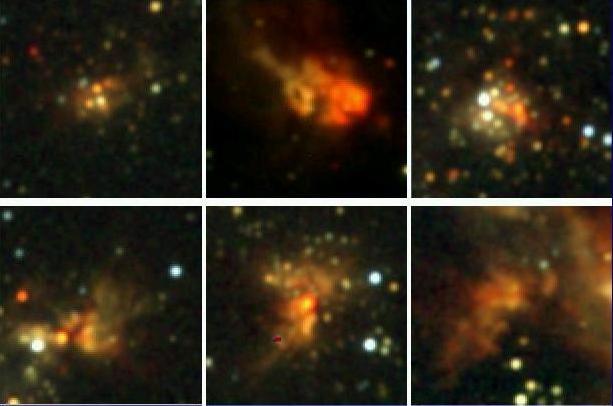 The montage of six
young clusters at right derives from fields contained in the
Spring 1999 data release. Because of nebulosity and source confusion,
the automated flux extractions from the 2MASS pipeline may
not represent the best quality photometry of these complex
regions. Many of these regions were detected as extended
sources by the pipeline and full resolution images are available
via the extended source full resolution
image server.
The montage of six
young clusters at right derives from fields contained in the
Spring 1999 data release. Because of nebulosity and source confusion,
the automated flux extractions from the 2MASS pipeline may
not represent the best quality photometry of these complex
regions. Many of these regions were detected as extended
sources by the pipeline and full resolution images are available
via the extended source full resolution
image server.
b. Galaxies
2MASS will detect between one and two million galaxies as extended sources. Owing to the transparency of interstellar dust within the galaxies and to the dominance of late-type stellar population in producing galactic near-infrared flux, the 2MASS galaxy images largely trace the overall stellar mass distribution. The top row of images below include examples of 2MASS galaxies of large angular size. Although these images emphasize the smoothness of the light distribution arising from the dominance of late-type stars rather than early-type stars, they are unrepresentative of the typical 2MASS galaxy. The bottom row is a more random sampling of 2MASS extended sources, which tend to be only marginally resolved from a point source.
 |
 |
 |
 |
 |
 |
 |
 |
 |
Regardless of angular size, this huge sample of small galaxies will
form the foundation of future redshift studies of the local universe.
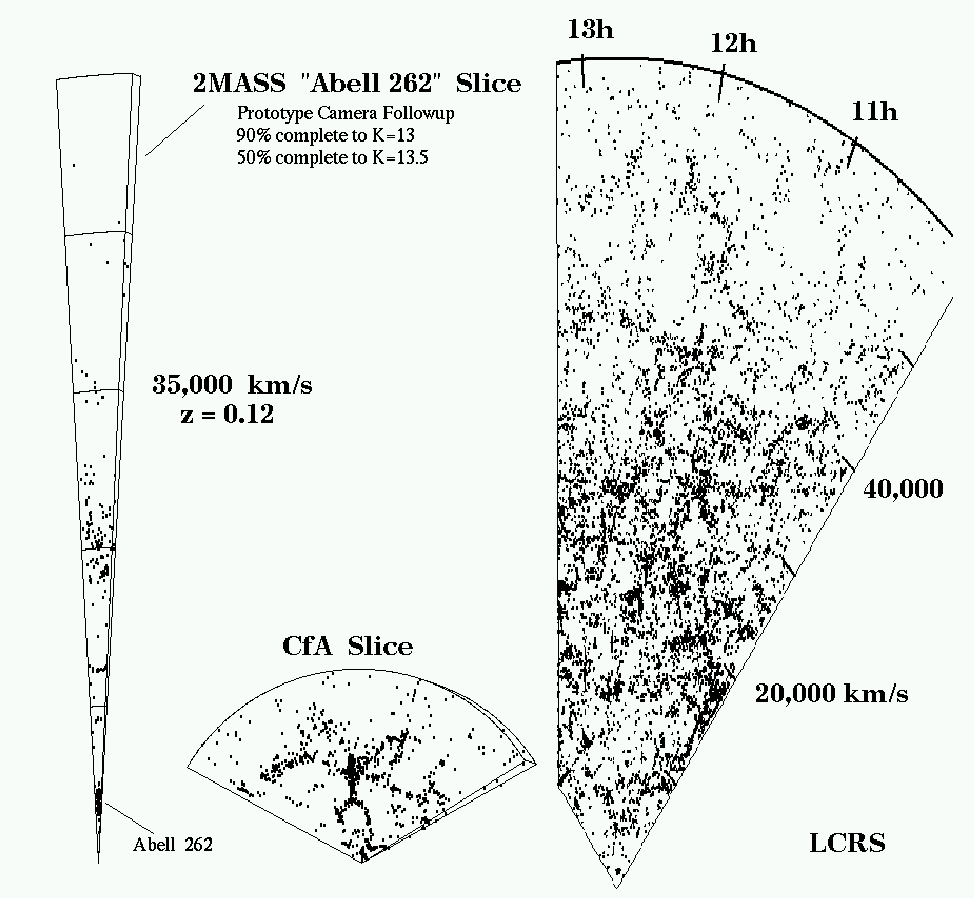 The
figure at right shows the spatial distribution of a fraction of the
2MASS extended sources in a 1°×6° slice of the universe in the
direction of the cluster Abell 262. 2MASS redshift followup will
trace structures to redshifts z>0.1.
2MASS penetrates the Galactic interstellar medium to detect a
substantial number of galaxies, even in the midst of
the Galactic plane. A striking example of an optically-obscured
galaxy revealed by 2MASS appears at left.
The
figure at right shows the spatial distribution of a fraction of the
2MASS extended sources in a 1°×6° slice of the universe in the
direction of the cluster Abell 262. 2MASS redshift followup will
trace structures to redshifts z>0.1.
2MASS penetrates the Galactic interstellar medium to detect a
substantial number of galaxies, even in the midst of
the Galactic plane. A striking example of an optically-obscured
galaxy revealed by 2MASS appears at left. 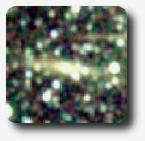 . Many other
such examples are compiled here. Unlike the
broad visible-wavelength "zone-of-avoidance," the
2MASS zone-of-avoidance is restricted to the core of the Milky Way stellar
distribution. Only at galactic latitudes typically <10°
does stellar confusion begin to degrade the
completeness and reliability of the 2MASS galaxy selection.
. Many other
such examples are compiled here. Unlike the
broad visible-wavelength "zone-of-avoidance," the
2MASS zone-of-avoidance is restricted to the core of the Milky Way stellar
distribution. Only at galactic latitudes typically <10°
does stellar confusion begin to degrade the
completeness and reliability of the 2MASS galaxy selection.
Galaxies have unique colors relative to stars in the 2MASS wavelength bands owing to the effects of internal extinction and star formation. The k-correction due to cosmological redshift enhances this color separation from the locus of ordinary stars (and even enables the extraction of relatively accurate photometric redshifts for dense clusters). A J-H vs. J-Ks color-color plot of faint point sources (the high-latitude plot discussed above for the 12 hour to 15 hour range for the complete first release dataset) shows the galaxies as a separate population. This color difference is enhanced by reddening in the Galactic plane, where the light from galaxies must traverse the entire extent of the Milky Way disk. The 2MASS extended source catalog includes a "g"-flag, which includes color in an assessment of whether an extended source is likely to be a galaxy.
[Last Updated: 2000 Feb 11; by M. Skrutskie]
Previous page. Next page.
Return to Explanatory Supplement TOC Page.