IV. 2MASS Data Processing
4. Point Source Detection and Photometry
Aperture photometry is also performed for each candidate detection
from the Atlas Images to provide a reference to the absolute photometric
scale for the profile-fit photometry, statistics on the detectability
of an object, and as a back-up source of brightness information
when profile-fitting fails to converge to a valid measurement.
As with the profile fitting, the aperture photometry
is made at the position of the faint detections on the individual frames.
The brightness is measured in a series of apertures ranging in radius
from 3´´ to 14´´, in 1´´ steps, by summing pixels
entirely within the aperture and interpolating pixels partially
within the aperture. The sky background for each object is computed in
an annulus with an inner radius of 14.0´´ and an outer radius of
20.0´´. Pixels in the sky
annulus are entirely included or excluded based on the distance of
their centers from the source. The sky value is estimated by first
excluding saturated, masked, or unreasonably low pixels.
A The multiple aperture photometry for all sources observed under the
same seeing conditions during a 2MASS survey scan is used to
to determine the curve-of-growth correction to the
aperture measurements. The curve-of-growth correction is defined to be the
constant factor that when applied to "standard aperture" magnitudes
(measured in the 4´´ radius aperture) makes them equivalent to an
"infinite" size aperture.
This accounts for any light that falls
outside of this aperture without suffering from degraded signal-to-noise ratio
that would result from simply using the measurement from large apertures.
The curve-of-growth correction is seeing
dependent: when the seeing is poorer, the correction is larger. The
curve-of-growth is evaluated by calculating the differences between successive
aperture magnitudes for each R2-R1 source and testing for when the
differences converge to zero, or when the differences begin to
diverge, within measurement uncertainties.
The correction is the median difference between the
4´´ aperture magnitude and the magnitude in the aperture at which the
magnitude differentials become zero, for a large ensemble of stars.
J-band curves-of-growth evaluated during periods of good (2.5´´ FWHM)
and bad (3.4´´ FWHM) seeing in scans from the Second Incremental Data
Release are shown in Figure 3 and
Figure 4,
respectively. The x-axes show aperture radius in pixels (2´´/pixel),
and the y-axes show the difference between successive aperture magnitudes
vs. the outer radius. Indicated on the figures are the
radius of the "standard aperture" (open circle), and the radius at
which the curve-of-growth was determined to converge (open star).
The good seeing case shown in Figure 3,
converges at a smaller radius, 2.5 pix, than the poor seeing case, 4.0 pix.
The curve-of-growth correction determined
in these examples were -0.016+0.005 mags and -0.121+0.015 mags,
respectively.
c. Aperture Photometry and Curve of Growth Correction
 -trimmed
median of the surviving sky pixels is then used as the sky estimate.
The aperture measurements from each of the six input frames are
combined using an unweighted average.
Aperture measurements are usually possible on six frames for each detection.
However, if one of more of the frames contains a masked pixel within 4" of the
source location, that frame is excluded from the the measurement.
The aperture measurements from each of the remaining input frames are
combined using an unweighted average. The "ndet_flg" parameter included
in the Second Incremental Release PSC record is a six-digit flag (two digits
per band) that tabulates the number of
frames on which a >3 aperture photometry
detection was made ("N") and the number of frames available for
measurement ("M"), for each band of
each source. (This defines the N/M statistic.)
For example, an "ndet_flg" value of
"665634" indicates that a source had six >3
detections on six possible frames in the J-band, five detections
on six possible frames in the H-band, and three detection on four
possible frames in the Ks-band.
For brighter sources, the "ndet_flg" parameter can be used as
a reliability
indicator, and for fainter objects, it can be used as a sensitivity
indicator.
-trimmed
median of the surviving sky pixels is then used as the sky estimate.
The aperture measurements from each of the six input frames are
combined using an unweighted average.
Aperture measurements are usually possible on six frames for each detection.
However, if one of more of the frames contains a masked pixel within 4" of the
source location, that frame is excluded from the the measurement.
The aperture measurements from each of the remaining input frames are
combined using an unweighted average. The "ndet_flg" parameter included
in the Second Incremental Release PSC record is a six-digit flag (two digits
per band) that tabulates the number of
frames on which a >3 aperture photometry
detection was made ("N") and the number of frames available for
measurement ("M"), for each band of
each source. (This defines the N/M statistic.)
For example, an "ndet_flg" value of
"665634" indicates that a source had six >3
detections on six possible frames in the J-band, five detections
on six possible frames in the H-band, and three detection on four
possible frames in the Ks-band.
For brighter sources, the "ndet_flg" parameter can be used as
a reliability
indicator, and for fainter objects, it can be used as a sensitivity
indicator.
|
 |
| Figure 3 | Figure 4 |
i. Photometric Normalization
The point source profile-fit photometry is tied to the absolute photometric
scale of the system by normalizing to the
curve-of-growth-corrected aperture photometry. This is done separately
for all sources in a survey scan having the same seeing value, since the
normalization can change with seeing. The median offset between profile-fit
and curve-of-growth-corrected aperture photometry
is calculated iteratively with 3 rejection for
all stars. The resulting offset correction is added to the profile-fit
photometry, and this corrected value is the "default magnitude" listed in the
Point Source Catalog record for most sources ("rd_flg" = "2").
Figure 5 shows the relationship between
profile-fit and curve-of-growth-corrected aperture magnitudes for a scan
in the Second Incremental Data Release, after the normalization correction
has been applied to the profile-fit photometry. In some regions of
very low source density, there are not enough sources to empirically
determine the normalization. In these cases, a normalization factor
is selected from a table indexed by the seeing.
The R1 aperture photometry
for all sources is then normalized to the corrected profile-fit photometry,
using objects that are both bright enough to have been detected in
the R1 frames but below the R2-R1 saturation limit, and therefore having
valid profile-fit photometry.
There is typically 2-3 magnitudes of overlap to provide an empirical
measure of any offset between the photometric scales.
As with the profile-fit/aperture photometry normalization, the median
offset between the R1 aperture and corrected profile-fit photometry
for all available sources is calculated iteratively using
3 rejection.
This correction is then applied to the R1 photometry for all sources,
and the corrected magnitudes are listed in the "default magnitude" fields
for the Second Incremental Data Release Point Source Catalog for all objects
saturated in
the R2-R1 exposures ("rd_flg" = "1").
Figure 6 shows the normalized R1 magnitudes plotted as a function
of their equivalent corrected profile-fit magnitude for a night
in the Second Incremental Data Release. This figure also illustrates the
overlap in the range over which both R1 and R2-R1 provide useful
measurements. In low source density regions there may not be enough
bright stars to allow measurement of the R1 normalization factor.
In these cases, a pre-evaluated factor is selected froma table indexed
by seeing.
|
 |
| Figure 5 | Figure 6 |
ii. Curve-of-Growth and Photometric Normalization Errors
Under certain circumstances the empirical curve-of-growth and photometric normalization derivations can be contaminated and produce systemmatic errors in the quoted photometry in one or more 2MASS bands.
Large numbers of spurious source detections can occur in the vicinity of very bright stars during scan processing. These spurious "detections" do not have normal source profiles, and therefore produce erroneous curve-of-growth profiles and photometric normalizations. If the spurious sources are numerous enough they will dominate the statistics of the curve-of-growth and/or normalization derivation for their seeing value within a Tile, and aberrant corrections will be applied to all sources in the Tile having that seeing value, even well away from the bright star. These anomalous corrections can be more than one magnitude in error and usually affect only one band in a Tile, leading to extremely unusual source colors. These cases have been identified in the Second Incremental Release PSC; sections of only 26 out of the 27,493 Tiles in the release are affected. Sources for which this is known to be a problem have a "cc_flg" value of "C" in the appropriate band.
In very high source density regions, aperture photometry can be corrupted due to confusion within source apertures and in the background sky annuli. Such confusion will lead to biased curve-of-growth measurements and therefore in the reported photometry in one or more bands within a Tile. The amplitude of this bias can be as large as 0.1-0.2 mags, and because it often affects only one or two bands this effect produces biased colors in portions of a Tile. This bias is also spatially correlated within a Tile because the curve-of-growth is evaluated separately for all sources having a particular atmospheric seeing shape. The seeing is estimated on spatial frequencies no finer than the scale of an Atlas Image (17 arcminutes). Thus, the biased photometry and colors will manifest themselves on Atlas Image or larger scales within a Tile.
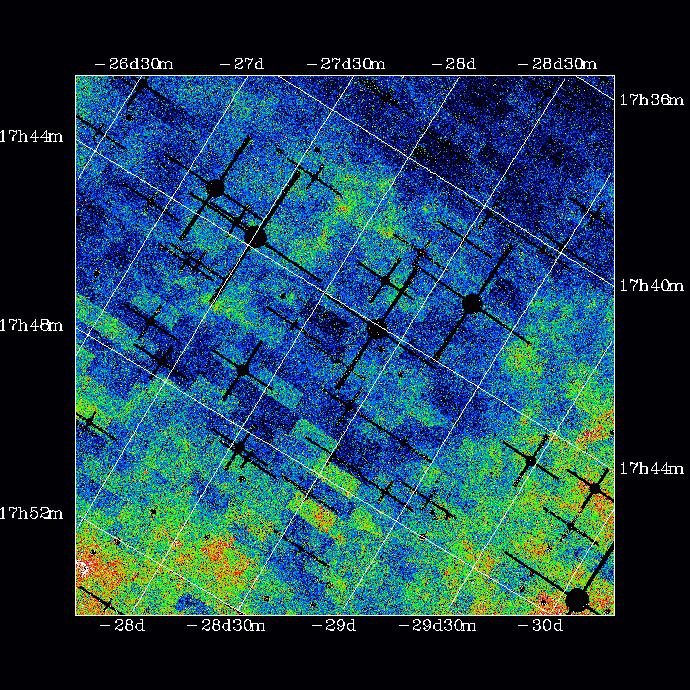
An example of this bias is illustrated by the map in Figure 7 which shows the spatial distribution of mean H-Ks colors of PSC sources in a 3°×3° field centered near l=357°, b=+4°. The map is shown in a galactic coordinate projection with the Galactic Plane off the bottom of the image, but with an equatorial coordinate grid overlay to illustrate the direction of the 2MASS Survey Tiles. Blue denotes smaller values of the mean H-Ks color and red denotes larger mean H-Ks color. The mean reddening of stars in the direction of the Galactic Plane and the filamentary red regions are real and trace trends in interstellar extinction. The rectangular artifacts within the image highlight portions of the Tiles in which the point source photometry has been biased due to erroneous curve-of-growth corrections, producing correlated regions with colors that are either too blue or too red by as much as 0.2 mags. relative to the rest of the field.
Lying only a few degrees from the Galactic Center, the source density in this field is extreme, ~92,000 deg-2. Analysis of the curve-of-growth derivations over the life of the Survey indicates that the empirical estimation is susceptible to contamination due to confusion at source densities higher than ~65,000 deg-2. Therefore, users should excercise caution when carrying out statistical studies of source color within 10°-15° of the Galactic Center, or any other region with very high source density over several degree scales. Confusion-induced curve-of-growth errors will be avoided during the final uniform processing of the 2MASS data by eliminating the empirical derivation of the curve-of-growth in every Tile and instead utilizing a look-up table of curve-of-growth corrections keyed to seeing values derived from all survey data.
 |
| Figure 7 |
[Last Updated: 2000 June 20; by R. Cutri, T. Evans, J. Carpenter]
Previous page. Next page.
Return to Explanatory Supplement TOC Page.