IV. 2MASS Data Processing
8. Photometric Calibration
a. Photometric Zeropoint Evaluation
The transformation between instrumental and calibrated 2MASS magnitudes applied to all point and extended sources is:
Mcal = Minst + c1 - c2(X-1.0)
where
- c1 is the photometric zeropoint offset (magnitudes)
- c2 is extinction coefficient (magnitudes/airmass)
- X is airmass (sec z)
- Minst is measured instrumental magnitude of star, and
- Mcal is the calibrated magnitude.
Each of the coefficients is a function of wavelength. Note that no color coefficients are included in the 2MASS photometric transformations, so all photometry is reported in the natural "2MASS system."
The photometric zeropoint offsets, c1(J,H,Ks), are evaluated each night at each observatory using the nightly calibration observations. The nightly H and Ks band zeropoints are fit to a constant value that is evaluated from the average difference between the "true" catalog (Mcat) and extinction-corrected instrumental (Minst´) magnitudes for all primary and secondary standards measured during the night:
c1(H,Ks) = < Mcat - Minst´ >
where
Minst´ = Minst - c2(H,Ks)(X-1.0)
The plots of photometric zeropoint offsets vs. survey day number, shown in Section III.1.c, illustrate that the J-band offset varies night-to-night by nearly a factor of two more than the those at H and Ks, and therefore probably changes within a night more than the longer wavelength values. Thus, the nightly J-band zeropoint offset is derived by fitting the differences between catalog and extinction-corrected instrumental magnitudes as a linear function of time (T):
c1(J,T) = c10 + (Mcat - Minst´) * T
where again
Minst´ = Minst - c2(J)(X-1.0).
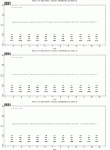
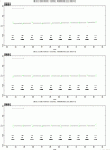
As an example, Figure 1 and Figure 2 show the the photometric zeropoint offset solutions for the night of 1998 October 11 UT in the north and south, respectively. Each green point in these figures shows the average value of Minst´ from a calibration scan plotted as a function of time (in UT hours), with J-band on the top, H-band in the middle and Ks on the bottom. Each cluster of green points represents the six scans in a calibration observation. The black points between the calibration scan points indicate the zeropoint solution that is applied to the scans of Survey Tiles made at the indicated time. The error bars on the black points represent the RMS uncertainty in the zeropoint solution for the night. The derived zeropoint coefficent solutions for each hemisphere on this night are:
North:
c1(J) = 0.0570 + 0.0003 * T(hr)
c1(H) = 0.0158 + 0.0033
c1(Ks) = 0.0428 + 0.0066
South:
c1(J) = 0.0461 + 0.0024 * T(hr)
c1(H) = -0.0011 + 0.0085
c1(Ks) = 0.0013 + 0.0077
The photometric zeropoint coefficients derived for each night included in the 2MASS Second Incremental Data Release are tabulated in the Scan Information Table (cf II.6.d).
The nightly zeropoint offset coefficents are a measure of atmospheric transparency. Large (more positive) values indicate higher atmospheric transparency and better effective sensitivity. The long-term zeropoint plots shown in Section III.1.c illustrate seasonal variations in the zeropoints. Most pronounced are the transparency drops during the July-August period at Mt. Hopkins, corresponding to the southern Arizona "monsoon" season when atmospheric water vapor content is high.
b. Extinction Coefficients
The atmospheric extinction coefficients (c2 above)
used in the nightly calibration solutions are not derived solely from
the nights' data. Rather, all calibration observations are combined
in a global  2 minimization process to
derive internally
consistent photometry and long-term averaged extinction coefficients.
The extinction coefficients used
to calibrate the 2MASS Second Incremental Data Release photometry are:
North:
c2(J) = 0.109 mag/airmass
c2(H) = 0.031 mag/airmass
c2(Ks) = 0.061 mag/airmass
South:
c2(J) = 0.100 mag/airmass
c2(H) = 0.060 mag/airmass
c2(Ks) = 0.080 mag/airmass
c. Calibration Uncertainties
Photometric uncertainties quoted in the 2MASS Second Incremental Data Release Point and Extended Source Catalogs have the contribution of the nightly Photometric Calibration RMS uncertainties incorporated. For the PSC, the calibration uncertainty is combined in quadrature with the measurement errors ("<band>_msig") and other systemmatic terms in the "<band>_msigcom" fields. The uncertainties quoted for all magnitudes in the XSC have the calibration uncertainty combined in quadrature with measurement and other systematic errors.

|

|
| Figure 1 | Figure 2 |
[Last Update: 2000 February 9; by R. Cutri]
Previous page. Next page.
Return to Explanatory Supplement TOC Page.