VI. Analysis of the 2MASS Second Incremental Release Catalogs
2. Global Photometric Properties
b. Global Source Count Slope Maps
i. Summary
The main goal of this exercise was to examine the uniformity of the star counts at the Level 1 specification magnitudes. Outside of the galactic plane, we do not see any large scale inhomogeneities (over many square degrees) in the star counts near the Level 1 specifications. At high densities in the inner Galaxy, the differential star counts turn over near the Level 1 specifications. At the Galactic center, this begins to occur at least within 7° of the Galactic plane. By 15° longitude, the width of the band is ± 2.5°. This effect is still present at 80° longitude, but at a lower level. The star counts are rising again in the outer Galaxy, even in the Galactic plane. Qualitatively, this behavior is consistent with what one would expect when confusion noise begins to dominate the source extractions. There are a number of regions which show low star counts in the H-band images (see figures below). Presumably, this is due to H-band airglow. However, we have been unable to verify this yet by comparing the star counts maps with maps of the Atlas Image noise.
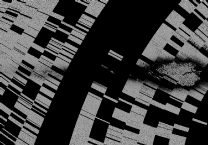
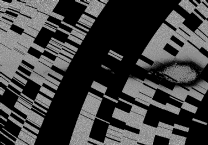
The figures below show various surface density maps at J, H, and K bands. Figures 1, 2, and 3 show surface density of stars between 10.0 and the Level 1 specification magnitude, i.e., 15.8, 15.1, and 14.3, at J, H, and Ks, respectively. The brighter regions represent high surface densities. Figures 4, 5, and 6 display crude measures of the slope of the star counts across the Level 1 specification magnitude for each band. The slope was measured at J band, for example, by taking the number of star counts between J=16.3 and 15.8, and subtracting the number of stars between J= 15.8 and 15.3. The difference was normalized by the total number of stars between 15.3 and 16.3 in order to remove the galactic structure. Red colors imply the differential star counts are increasing toward fainter magnitudes, and blue implies the differential star counts decrease toward fainter magnitudes. Near the galactic center, the star counts are clearly turning over, and this extends in a narrow band all the way out to 80° in galactic longitude. Figures 7, 8, and 9, show greyscale images of the slopes in the Galactic center between galactic longitudes 347° and 80° and latitudes -27° to +29° at each band. The counts away from the Galactic center are fairly uniform at J and Ks, but at H, a number of "holes" in the star counts are present. Presumably this is caused by airglow, but we have not yet been able to correlate these scans with high Atlas Image noise.

|

|
 |
| Figure 1 | Figure 2 | Figure 3 |

|

|
 |
| Figure 4 | Figure 5 | Figure 6 |

|
|
 |
| Figure 7 | Figure 8 | Figure 9 |
ii. Slope vs. Surface Density
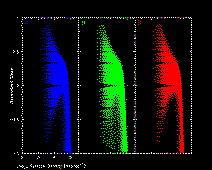
Figure 10 shows the normalized slope vs. star count density for JHKs for galactic latitudes less then 20°. At low surface densities, there is a large range in slopes. This is due to small number of counting statistics in a 5´-wide counting bin. There is a positive bias to the slopes which one would expect. At high surface densities, there is a sharp decline in the values of the slope which is due to source confusion in the Galactic Plane.
 |
| Figure 10 |
iii. J-Ks color
Figures 11, 12, and 13 show the average J-Ks color for point sources in 5´×5´ counting bins, for the entire sky, without annotation, the entire sky, with annotation, and a close-up view of the Orion/Taurus region (with annotation).

|
 |
| Figure 11 | Figure 12 |
 |
| Figure 13 |
[Last Updated: 2000 Mar 6 by J.M. Carpenter. Modified 2000 Jul 20 by S. Van Dyk.]
Previous page. Next page.
Return to Explanatory Supplement TOC Page.