


T. Jarrett, IPAC
(000707)
updated May 1, 2001
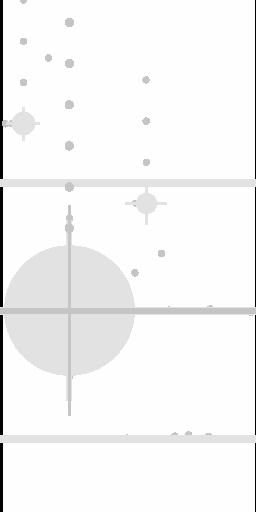
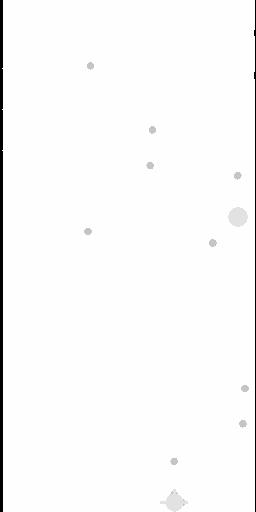
A few examples of GALWORKS "coverage" maps -- that is, masked regions. Masked areas are due to bright stars and their artifacts, bad pixels and low coverage areas (usually edges). The masks (right panel images) are coded thusly:
Here is an example of a full GALWORKS coverage cube. The top three panels show the GALWORKS masking for J, H and Ks, respectively, of this Abell 3558 field (J-band coadd). The bottom three panels show the corresponding PIXPHOT coverage for J, H and Ks, respectively. The darkest grey scales correspond to a maximum coverage of 7. The typical coverage is 6. The lighter greyscales correspond to 5 and less coverages.