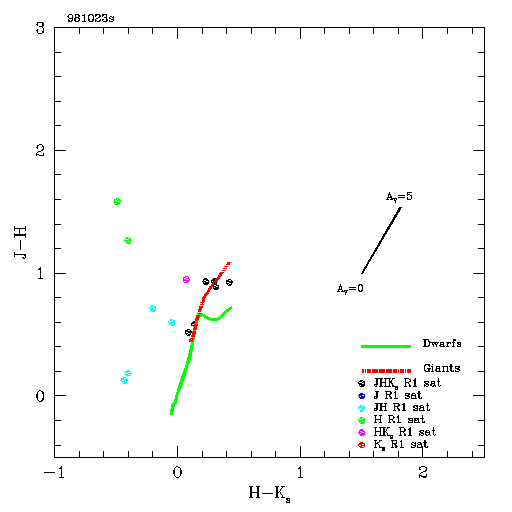
Abnormal color-color diagram of R1 saturated stars
C.X. 10.3.2001
During QA, Davy found an abnormal color-color diagram of R1 saturated stars in 981023s:
Gene and I looked into the two worst cases on this plot,
which are the two green spots that represent two
stars saturated in H. The most relevant data about these
stars can be summarized in the following table:
|scan| name
|type| V | g_lat
| J_2m| H_2m| K_2m|see_sh|
029 HD202034 K2 7.27
-34.4341 4.898 3.631 4.035 1.13
041 HD10957 K2
8.60 -66.6088 4.776 3.193 3.685
1.15
Here are what we found:
1) They are in the high-g_lat/low-density regions.
2) The J-K colors of them are reasonable given their
types (K2).
3) They have too red J-H (1.2 and 1.6, respectively)
and too blue
H-K (-0.4 and -0.5, respectively).
4) It most likely that the magnitudes of the H band,
the single
band at which these stars are saturated,
are too bright, rather than
the J and K band magnitudes are simultaneously
too faint.
5) Given that for both stars the seeing is rather bad,
it is likely that the
over-estimates of the H band brightness
are due to the seeing effect.
6) Using the seeing correction formula given here
I got a correction of 0.48 for the
H mag of HD202034 and 0.57
for the H mag of HD10957. After the
seeing correction,
these stars have J-H of 0.78 and 1.01,
respectively,
and H-K of 0.08 and 0.08, respectively.
These colors fit well into the
color-color diagram.
Conclusion: The anomaly is due to the seeing effect. After
the seeing
correction, which is prescribed in my website, the colors
of these stars look OK.