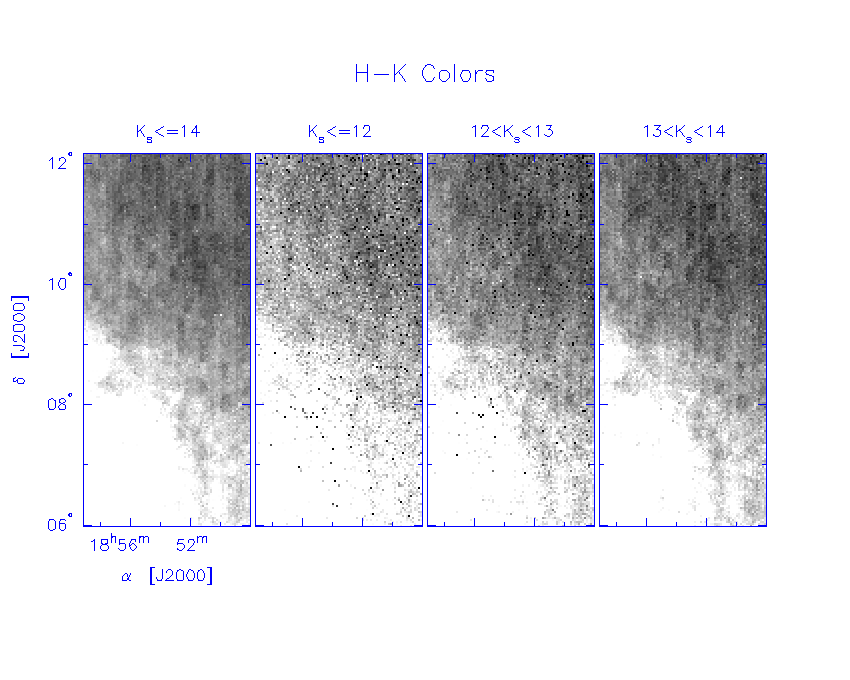
Notes:
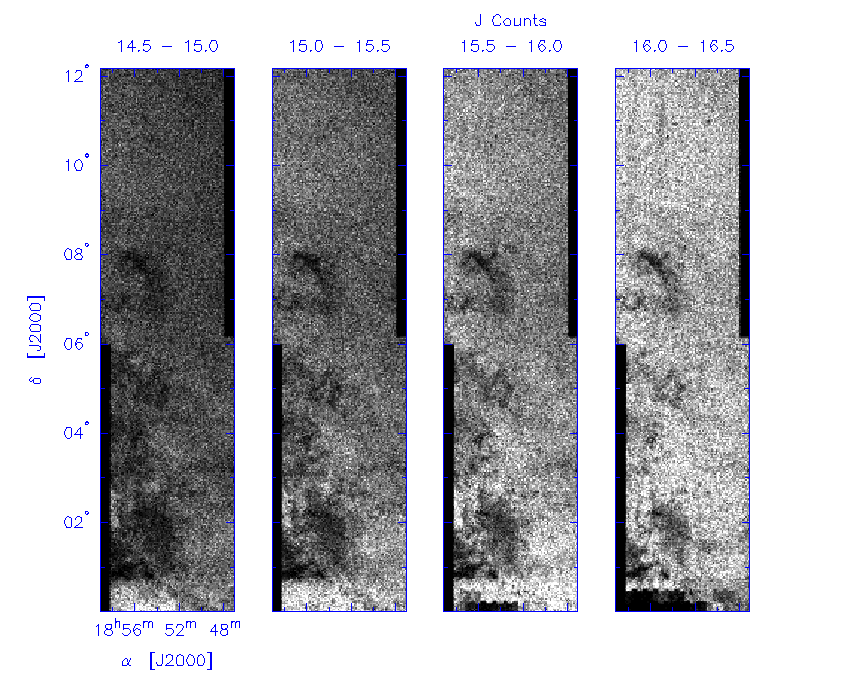
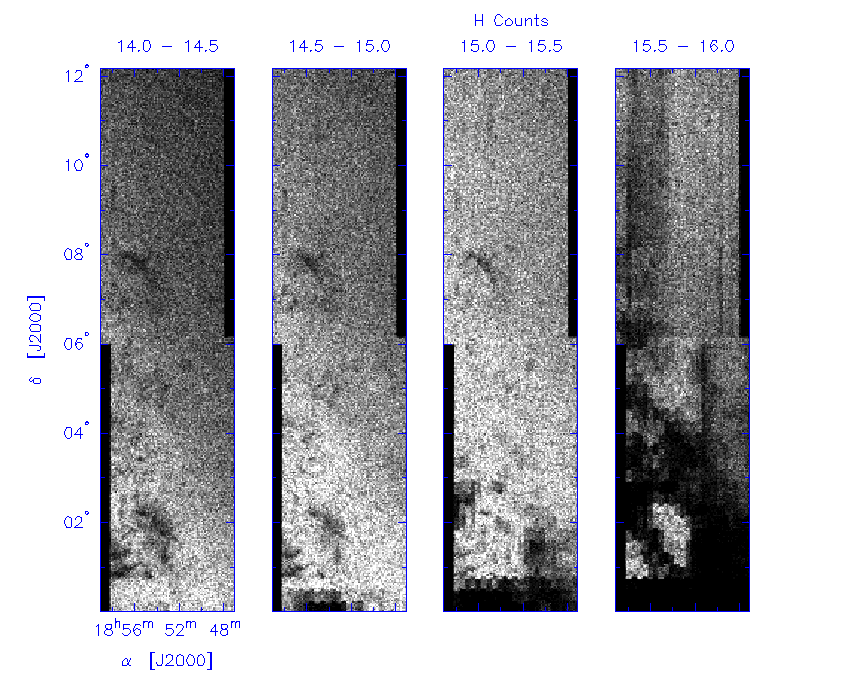
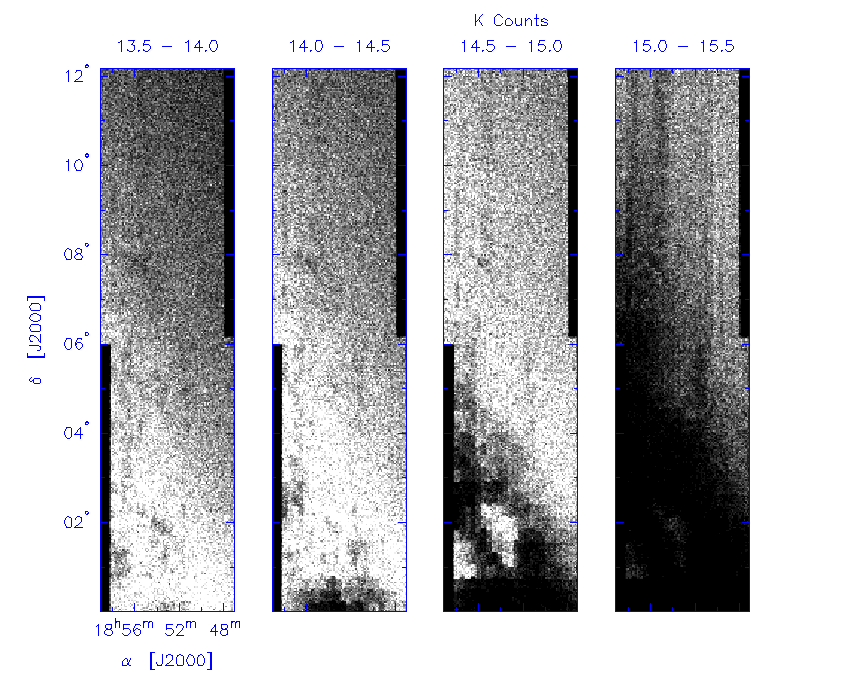
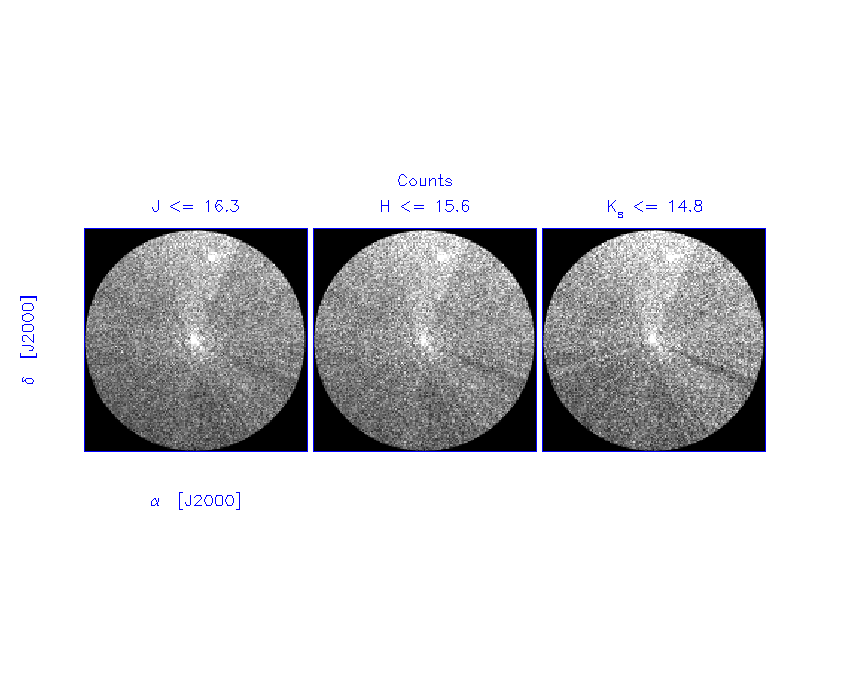
- Not surprisingly, the starcounts become incomplete toward relatively
bright magnitudes in each band. Note especially the lower left of
the starcount plot where the star counts are incomplete
at the Level 1 spec magnitudes.
- In generating the color plots, I used stars with a SNR >=7 in the
appropriate bands. Also, for J-K and H-K, I only used K <=14,
assuming that the star counts are reasonably complete for this magnitude
range.
- The "colors - zoom" plots zooms in on the top half of the image.
The tile patten can be clearly seen in the H-K image, and to a less
extent in the J-H image. It is not obvious in the J-K image, but the
large dynamic range in the J-K colors may possibly obscure the effect.
- Note also the abrupt changes in the colors in the lower left.
This looks suspicious, but I have not found found anything wrong with
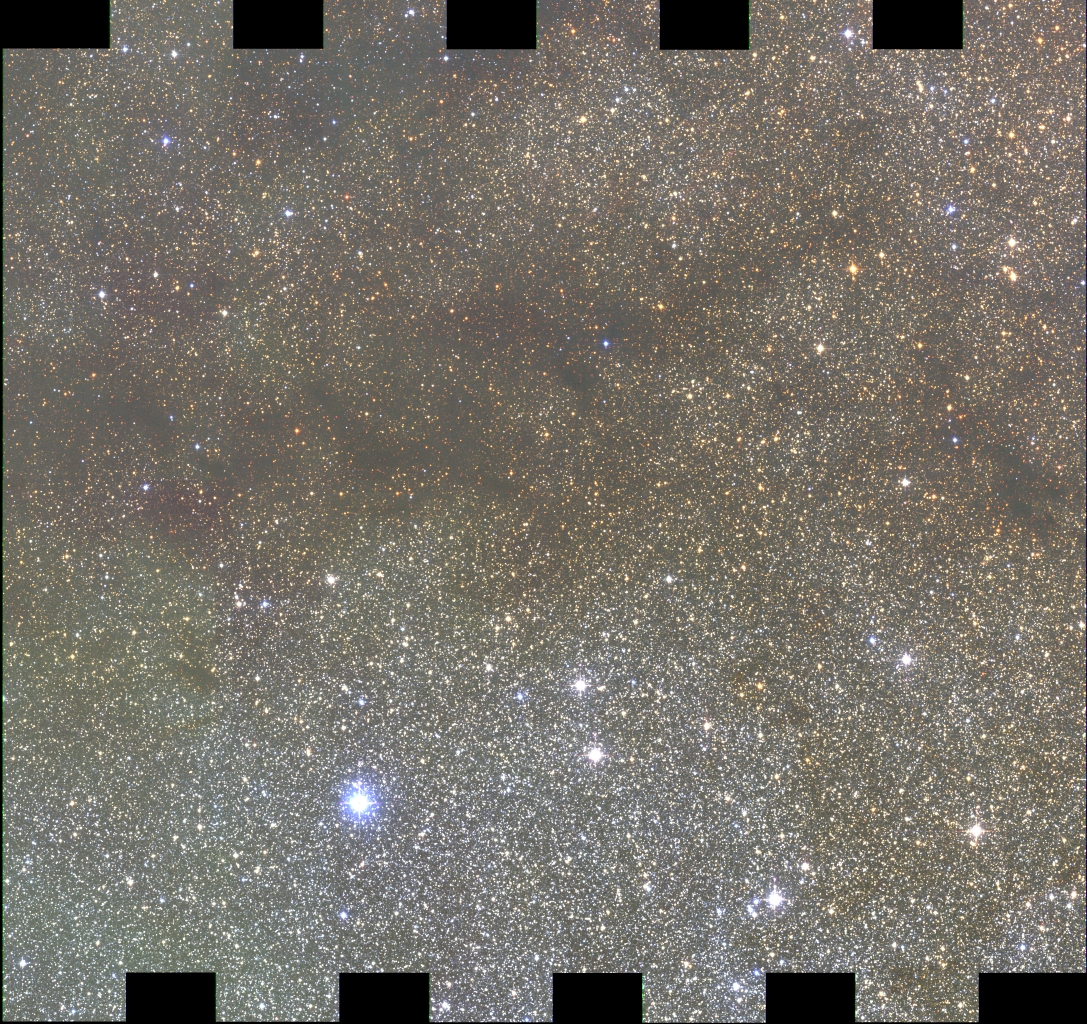
the data. When I made a JHK image of the
field from the 2MASS image atlas, it does in fact show the show is
elongated in right ascension.
-
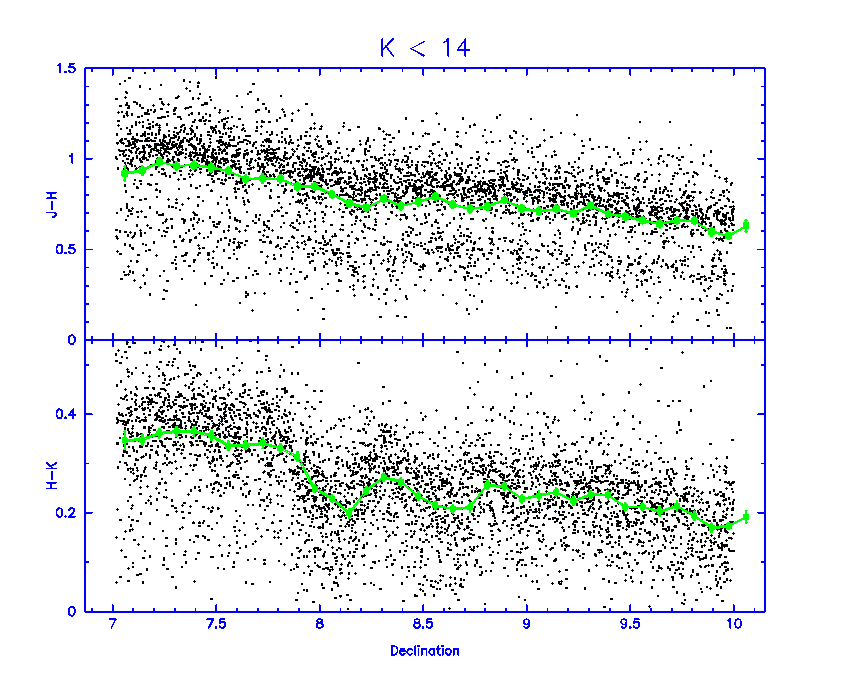
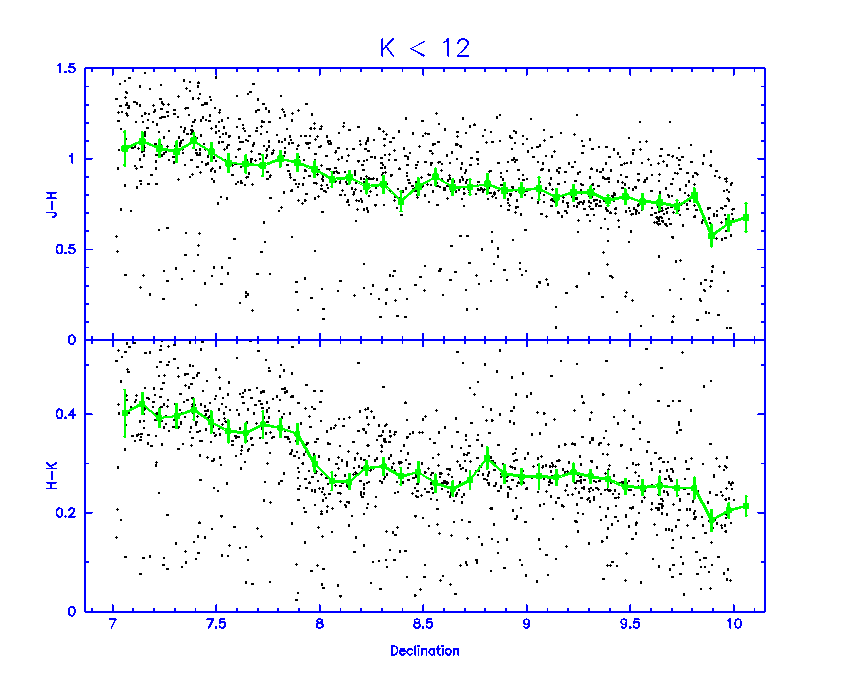
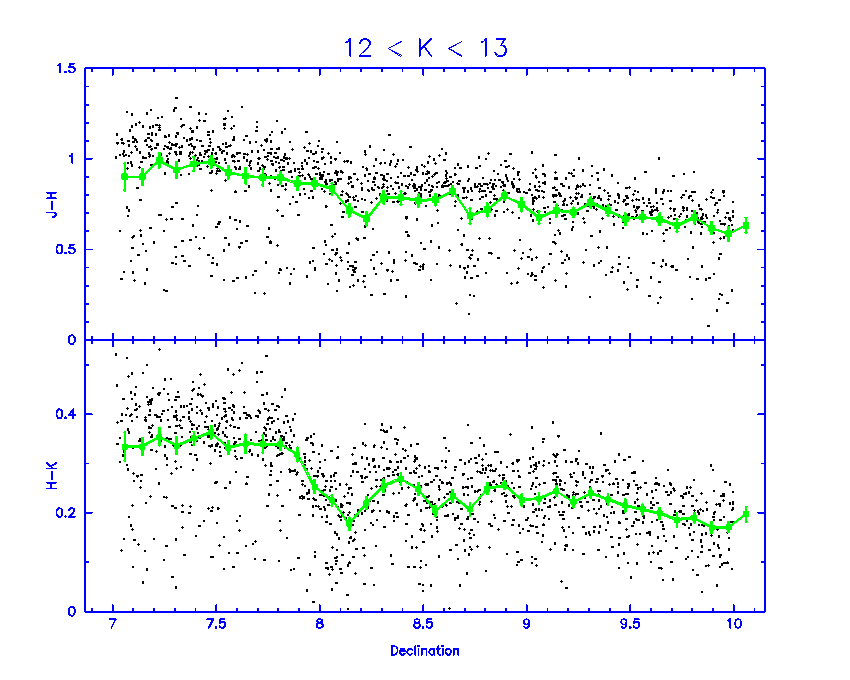
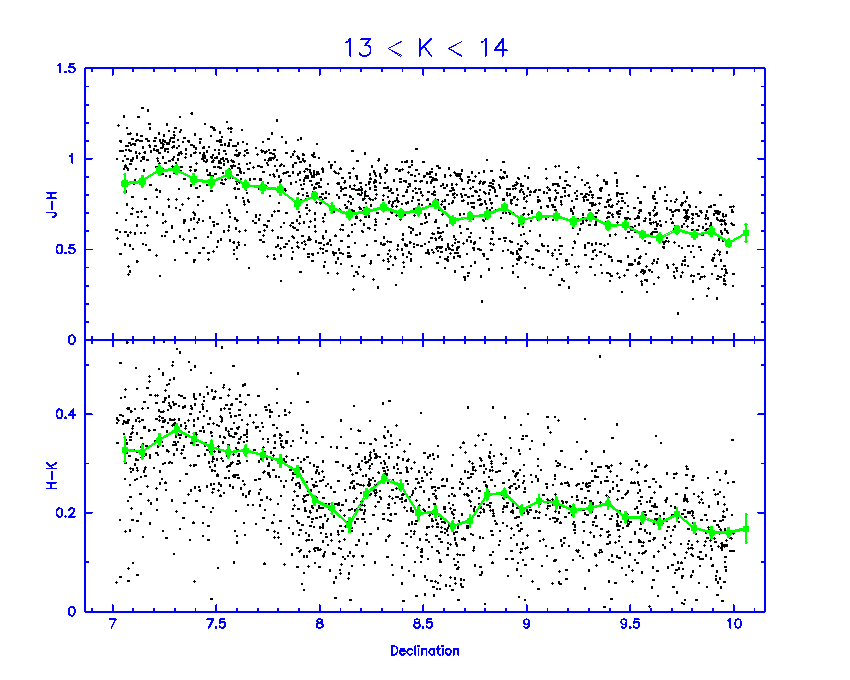
The plots labeled "colors vs. dec" show the
average H-K color vs. dec
over the region Laurent studied.
The black data points show the J-H and H-K colors vs dec for individual
stars, and the green curve shows the average colors binned in 5' intervals.
Laurent didn't label the declinations on his plot, but I assume that
the jumps in H-K color correspond to declinations of 8.1 deg and
8.6 deg in my plot.
The largest jump in H-K color is at dec=8.1. I estimated the jump in H-K
by first taking the average of the H-K color at dec=7.8 and dec=8.3
to remove the overall color gradient, and then computed the difference
between this average color and the observed color at dec=8.1.
Here are the results:
  Mag range.          d(H-K)
-------------   ----------------
   K < 14        0.103 +/- 0.009
   K < 12        0.070 +/- 0.019
12 < K < 13      0.119 +/- 0.014
13 < K < 14      0.112 +/- 0.016
This confirms Laurents result that the jump in H-K color is about 0.1 mag.
Also, the jump is independent of K magnitude within the errors.
|
Notes:
- The plots are orientated in RA/Dec, but the limits (RA: 0-360 deg,
dec: 84-90 deg, with dec=90 at the center) are not labeled since the
plotting package I use cannot label the polar region correctly. In
these images, the 2MASS tiles are orientated radially.
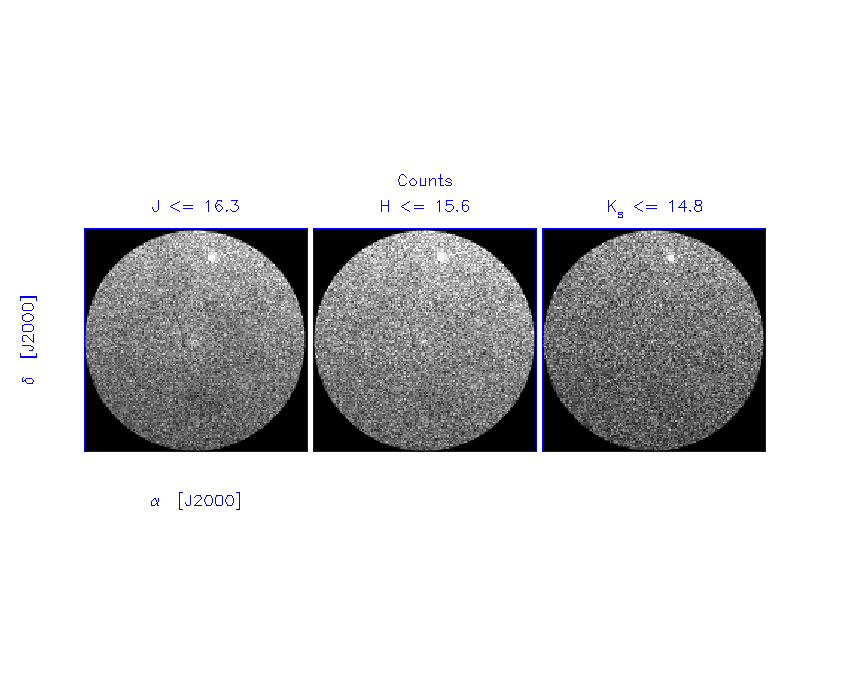
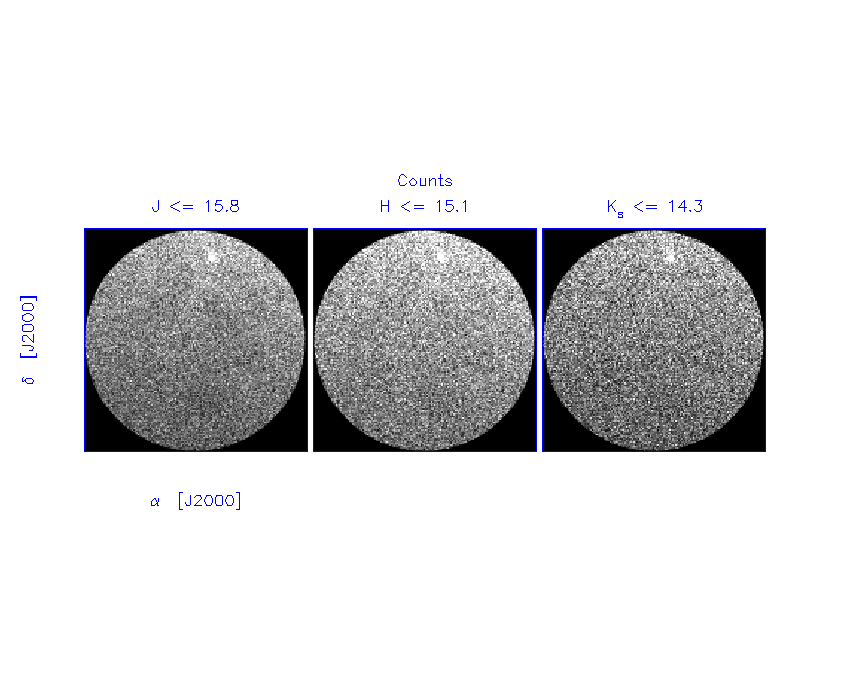
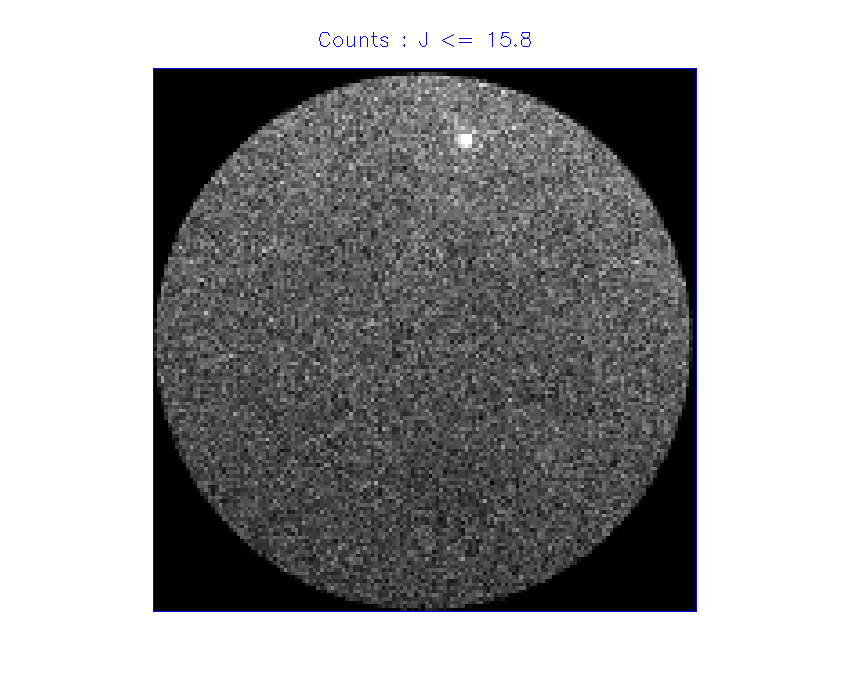
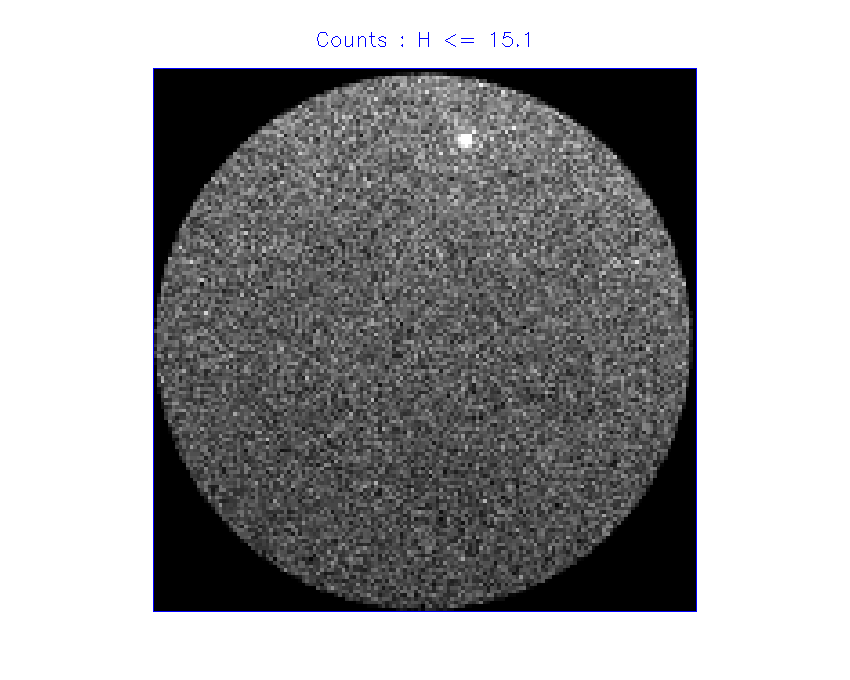
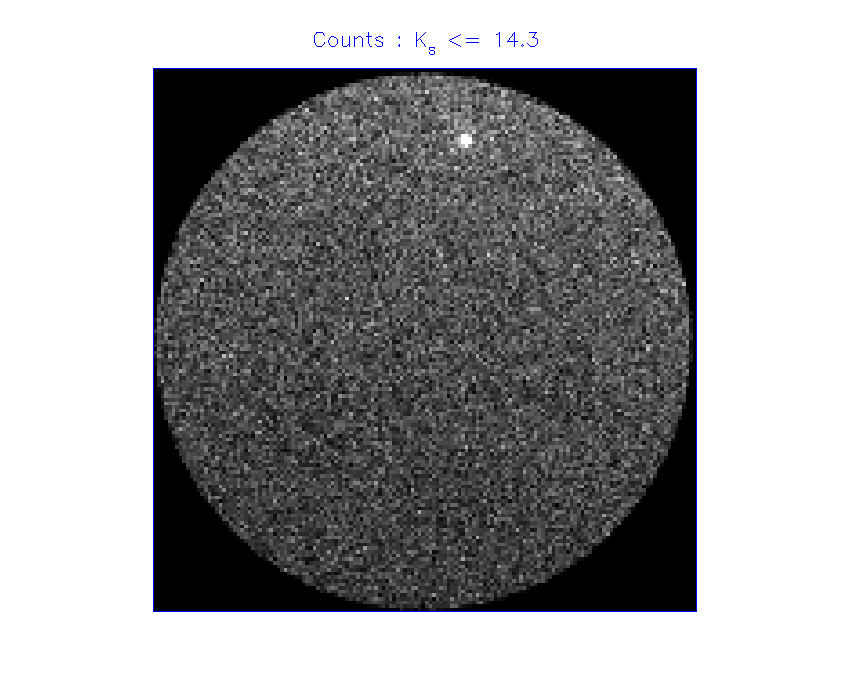
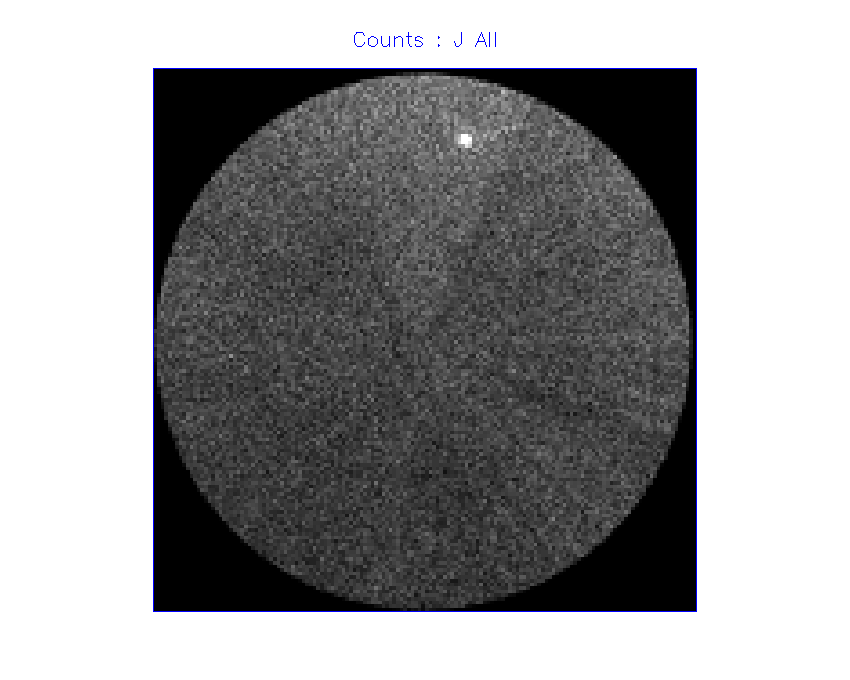
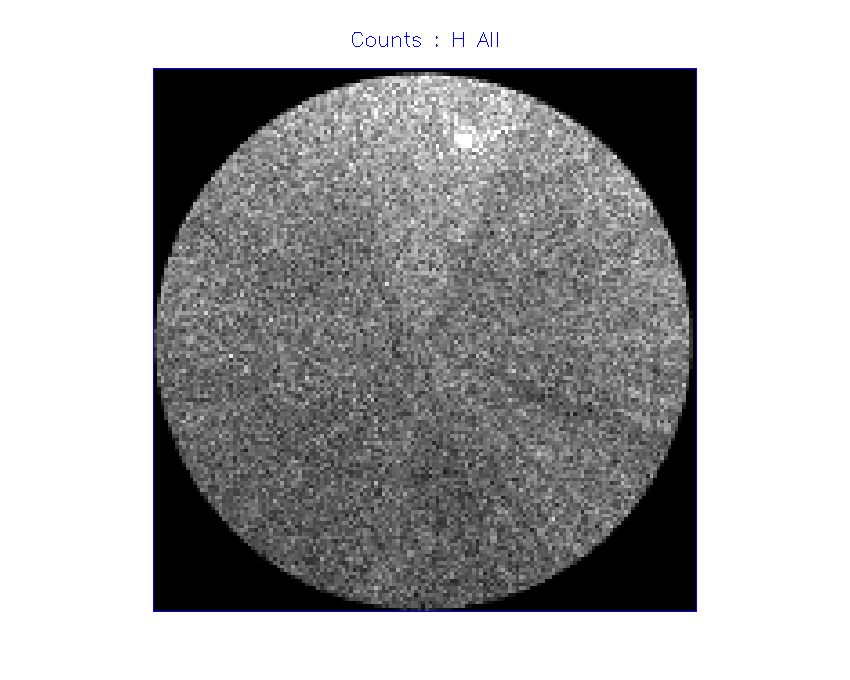
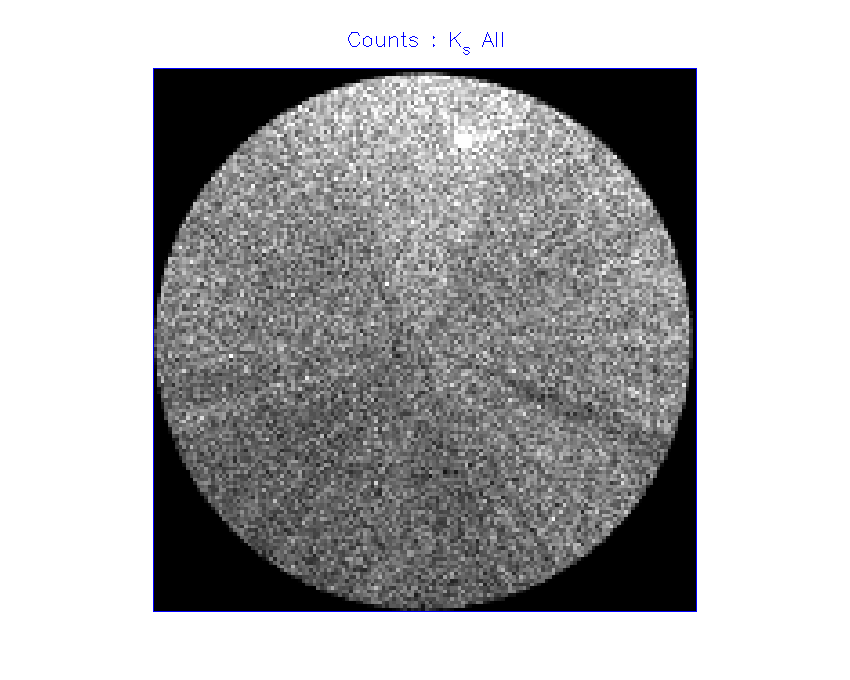
- The bright region near the top of the plots in the star count maps
is the cluster NGC 188.
- By my eye there seems to be variations in the H-K color map corresponding
to the tiles. (These will appear as radial spokes in these polar images.)
At least on of these tiles appears to correspond to a tile that has low
overall sensitivity compared the adjacent tiles. As usual I waited until
the night before the telecon to makes these images so I cannot be more
quantitative then this.
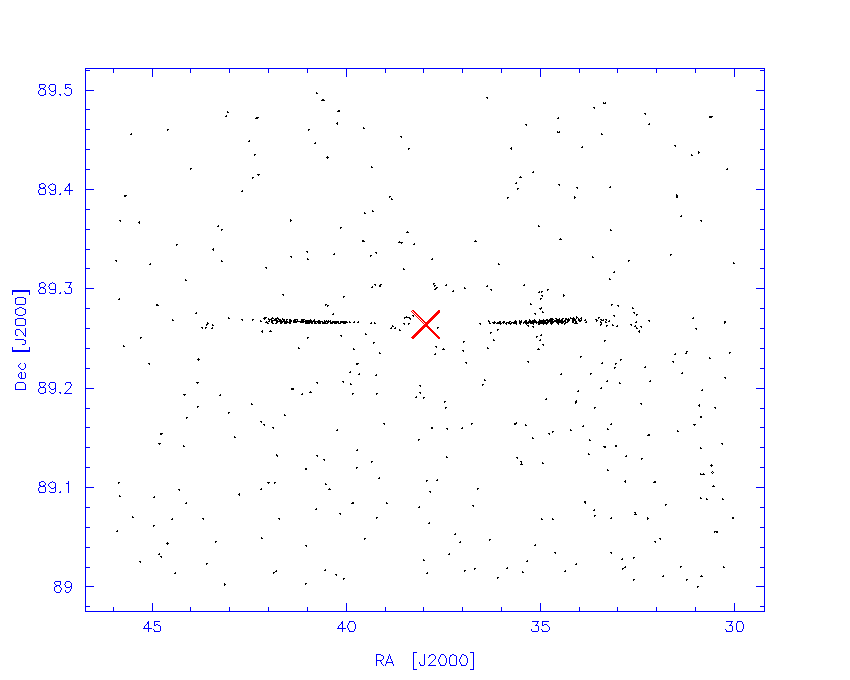
- I noticed one region in the star count map that is an artifact. I show
a spatial plot of the stars around this artifact in the figure below,
which clearly shows the sources are due to a diffraction spike.
The offending star is Polaris! What confuses
me is that the sources are not flagged as diffraction spike artifacts.
They are flagged as "c" (lower case "c", not upper case). I take this
to mean that the 2MASS processing pipeline thinks these sources are
real. I first I thought these were artifacts where Polaris was just
off of the coadded image, and since DBMAPCOR has not been run, this test catalog
would not know that these are artifacts. This is not always the case
though. For example, here is a gif image for
the "star" located at ra,dec = (33.022235,89.262497) that is located on the same
image as Polaris.
I identified coadd image 99 on night 000914 as one example where a few
sources were not identified as diffraction-spike artifacts. The point source
listing for the objects are listed below. After looking at more images, it
is clear that the majority of the artifacts shown on my web page result when
Polaris if off the edge of the coadd and thus could not have been identified
as diffraction spikes in this processing. The following though still should
have been identified as diffraction spike artifacts.
|  date|scan|         ra|        dec|    j_m|    h_m|    k_m|j_msig|h_msig|k_msig|rd_flg|bl_flg|cc_flg|extd_flg|mp_flg|  ndet|
 000914   99   32.398064   89.261917  15.802  14.274  14.441  0.140   null   null 200    100    000           0      0 260000
 000914   99   32.554876   89.262260  16.059  14.910  14.058  0.186   null   null 200    100    c00           0      0 160000
 000914   99   33.286783   89.262939  15.945  14.255  14.607  0.178   null   null 200    200    c00           0      0 560000
 000914   99   33.022235   89.262497  16.202  14.413  14.679  0.190   null   null 200    100    c00           0      0 060000
# Note following source is much brighter than the rest.
 000914   99   37.647565   89.260933   7.837   7.782   7.673   null   null  0.017 001    001    00c           0      0 000066
-
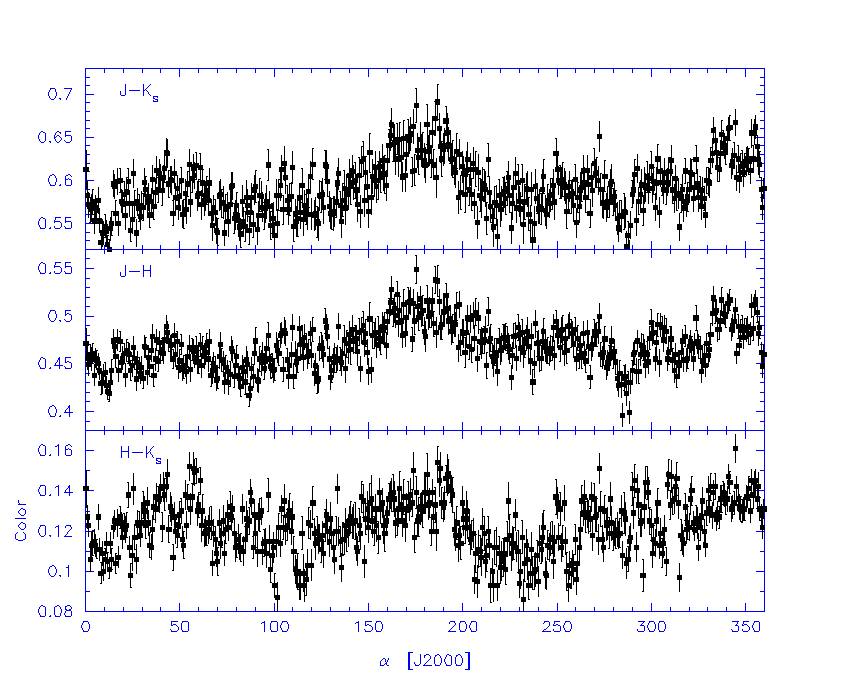
The "average color vs R.A." gif plots the average color vs. right ascension.
To decrease the contamination of the Polaris cloud to the colors, I only
included declinations between 84 and 86 deg. Still, the red colors at
ra=150-200 are from the polaris cloud.
The radial "spokes" that I was referring to can be seen as the
low H-K colors at ra=115 and ra=260. There is also a feature in the
J-H and J-K maps (but not H-K, so the problem is likely with J-band)
at ra=275. The magnitude of the offset is about 0.02-0.03 mag.
From Roc's
scan page
the offending tiles appear to be as follows:
H-K, Ra=115:
# Hemis data  scan   tile      ra           dec
n      990321   58   29610  111.359898   86.930727
n      990321   59   29611  112.518594   86.931093
n      990321   60   29612  113.679113   86.931219
n      990321   61   29613  114.842622   86.931358
n      990321   62   29614  115.987431   86.931644
n      990321   63   29615  117.152692   86.931920


H-K, RA=260:
# Hemis data  scan   tile      ra           dec
n      990418  121   29735  255.935836   86.932899
n      990418  122   29736  257.090768   86.932753
n      990418  123   29737  258.249080   86.932848
n      990418  124   29738  259.397300   86.933333
n      990418  125   29739  260.549003   86.933460
n      990418  126   29740  261.707508   86.933677


J-K, J-H, RA=275:
# Hemis data  scan   tile      ra           dec
n      991015   28   29749  271.887233   86.936659
n      991015   29   29750  273.044199   86.937270
n      991015   30   29751  274.200529   86.937499
n      991015   31   29752  275.355062   86.937490
n      991015   32   29753  276.510702   86.937508
n      991015   33   29754  277.665708   86.937347
n      991015   34   29755  278.821354   86.937396
n      991015   35   29756  279.976806   86.937533
Note that I just simply picked out the contiguous blocks at the appropriate
RA. It could be that any problems are confined to a subset of these scans.
- The plots labels "Star counts, Dup resolved" at the star count images
using the IPAC dup resolution. These were constructed to see if the dup
resolution if working correctly near the polar field, and the results
here indicate there are no problems.
| Counts: All |
Counts: Level 1 specs + 0.5 |
Counts: Level 1 specs |
|---|
 |
 |
 |
|
|---|
|
|---|
|
|---|
|
|---|
| Colors |
Artifact |
Average color vs. R.A. |
|---|
 |
 |
 |
|
|---|
|
|---|
|
|---|
|
|---|
| Star counts, Dup resolved : J < 15.8 |
Star counts, Dup resolved : H < 15.1 |
Star counts, Dup resolved : K < 14.3 |
|---|
 |
 |
 |
|
|---|
|
|---|
|
|---|
|
|---|
| Star counts, Dup resolved : All J |
Star counts, Dup resolved : All H |
Star counts, Dup resolved : All K |
|---|
 |
 |
 |
|


