I. The "N-out-of-M" Statistic
Source selection for the Point Source Catalog includes the requirements that candidate sources be detected in regions that had at least three frames available for measurement (M), and that brighter sources should have been detected on >40% of the frames on which measurements were possible (N). These requirements are designed to minimize contamination by spurious noise detections in low coverage areas and spurious detections of transient events such as cosmic rays, unmasked noisy pixels, and meteor trails. This web page examines the effects of these two requirements as imposed on the final point source databases.
The values of "N" and "M" are tabulated for each point source in the working database in the "ndet" column. The field contains a 6-digit integer which is 3 pairs of numbers, each pair corresponding to one band. The first number in each pair is, "N", the number of frames on which the source was detected in an aperture photometry measurement with an uncertainty <0.3619 mags (>3-sigma). The second number in each pair is, "M", the number of frames on which a measurement was possible. For non-saturated R2-R1 sources, the aperture photometry is done on the R2-R1 frames, for sources saturated in R2-R1, but not in R1, the aperture photometry is taken from the R1 frames. For sources saturated in R1, "N" is the number of frames on which a successful profile-fit was made on the saturated star. The "ndet" column in the point source database is constructed using the values in the ?_pix_flg fields.
II. Low Coverage Areas
Sources on the sky are normally sampled on six and sometimes seven frames during 2MASS scanning. Thus, the value of "M" is usually 6 or 7. The number of frame coverages can be less than 6 or 7 for several reasons including:
- A source can "walk" on or off an east or west scan edge because of the dither cross-stepping during a scan
- A measurement from a frame on which there is a masked pixel within 2 pixels of the source centroid will be rejected (pixels can be masked because of they are noisy, because of the influence of a cosmic ray, or because of a meteor trail)
- Sources near the R2-R1 or R1 saturation thresholds may be non-saturated in some frames and saturated in others, depending on pixel location and seeing
Interestingly, it is possible for a real source to have M=0 reported because the source detector can extract a source closer to the scan edge than the aperture photometry routines can operate. Such sources are visible in the images, but do not have valid measurements. Virtually all such detections will be filtered out of the catalogs by the scan edge-distance requirements.
II.1. Statistics
High Latitude
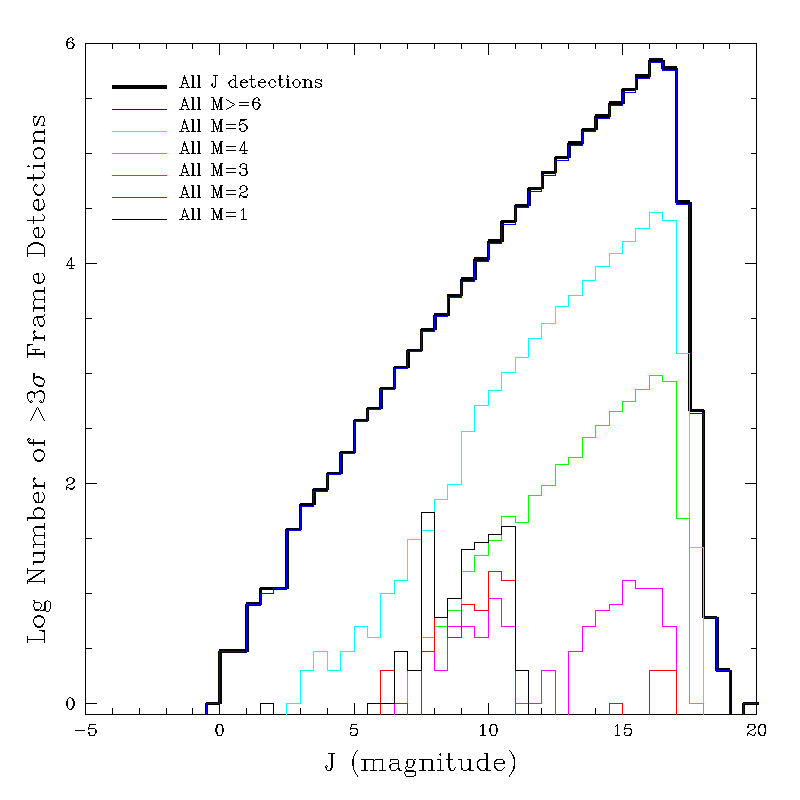
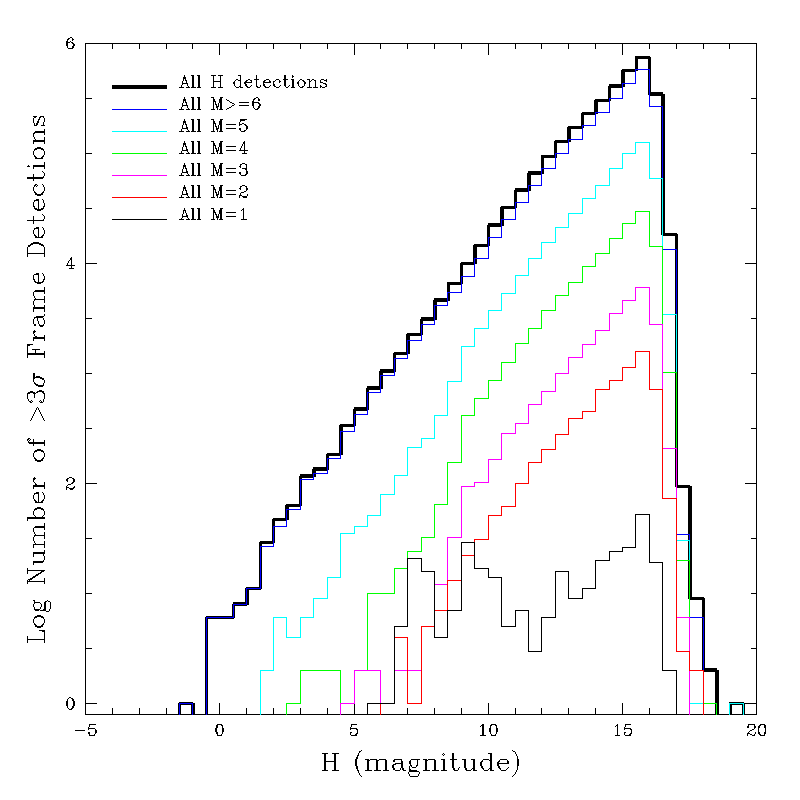
Figures 1a-c show the Log N-Log Mag distributions for 3,369,730 non-artifact sources in the |b|>70o sky that fall >10" from a scan edge and satisfy the SNR requirements for Catalog source selection, and that are measureable on different numbers of frames. In each figure, the total source counts are shown as heavy black lines, and source counts measureable on 6,5,4,3,2 and 1 frames are shown in blue, cyan, green, magenta, red and light black, respectively.
 |
 |
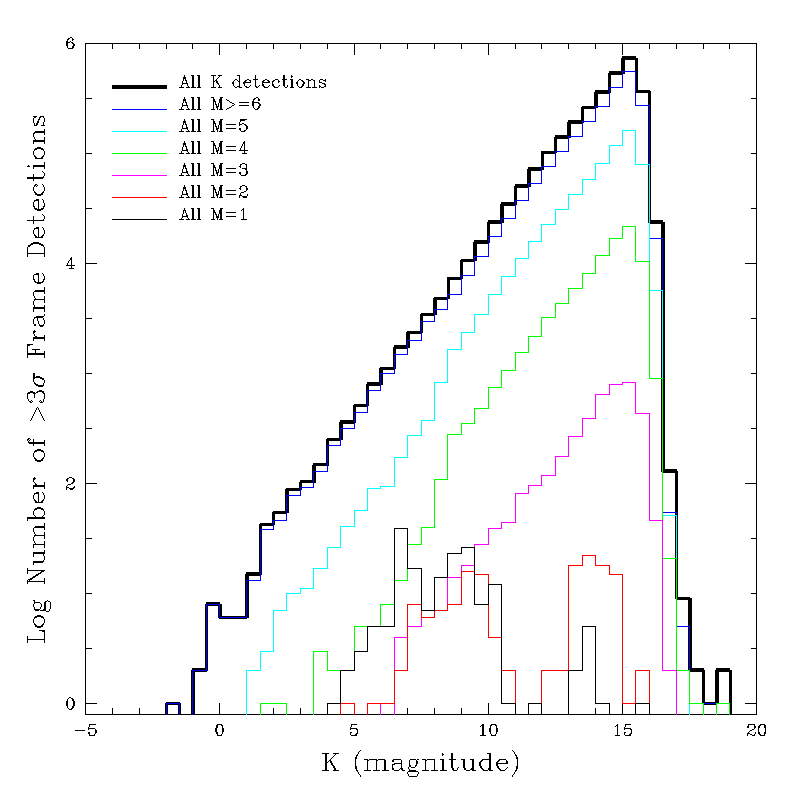 |
| Figure 1a - J-band | Figure 1b - H-band | Figure 1c - Ks-band |
The great majority of sources in each band are measurable in >6 frames. The distribution of sources measureable in 5 and 4 frames are well-behaved. In the J-band, the distribution changes significantly at M=3. Similar changes occur at M=2 in Ks and M=1 in H-band. For coverages below these break levels, the distributions become bimodal showing an excess of bright (R1) sources that are most likely not valid. The different coverage break levels in the three bands probably result from the different degree of fixed masking on the arrays. The northern and southern H-band arrays have the most masked noisy masked pixels (see below) while the J arrays have the fewest. Because the strength of 2MASS is as a K-band survey, and because it represents a compromise between J and H coverage extremes, the minimum coverage requirement for Catalog selection should be at M>3.
Some of the structure in the M<6 curves in each band is caused by stars straddling the R2 and R1 saturation levels. Near the saturation boundaries, source may be saturated on some frames and not saturated on others depending on seeing fluctuations and where a source centroid falls relative to pixel boundaries. At the R1/R2 saturation boundary, if a source has >=1 saturated pixel on any frame, the R1 frame aperture photometry is selected for the default magnitude. At the R1 saturation boundary, if a source is not saturated on one or more frames, the default magnitude is taken from the R1 aperture photometry on the non-saturared frames. Thus, the values of M reflects the non-saturated frame count for sources near the saturation boundaries.
All-Sky
To investigate if the M>3 frame coverage requirement adversely affects the survey completeness by excluding valid sources, a query was made of Final Processing Point Source Working DB to select all sources that a) meet the SNR, non-artifact, and edge-distance requirements for catalog selection, and b) have <3 frames possible in all bands. The query was made when the WDB contained ~9.1e8 entries, or ~69% of the total final processing volume. This query yielded 66,171 (0.007%) DB entries. Even if all of these objects were real, then the impact on the total survey completeness is negligible. As discussed below, most of these low coverage entries are not valid sources and should be excluded from the Catalog. However, the notable exceptions are bright R1 sources so their relative impact is more significant.
II.2. Location of Low Coverage Areas
Figure 2 shows the distribution of east-scan-edge distances for all detections with <3 possible frames available. The blue line is the distribution for northern low coverage sources, the green line is for southern sources, and the black line is the sum of north and south. The distributions were computed using the edge distances contained in the working DB, which are EW distances from "edges" interpolated between the reconstructed scan corners (using a great-circle interpolation). Therefore, the scan-edge distances do not correspond perfectly to array positions, but they are usually accurate to within a few camera pixels.
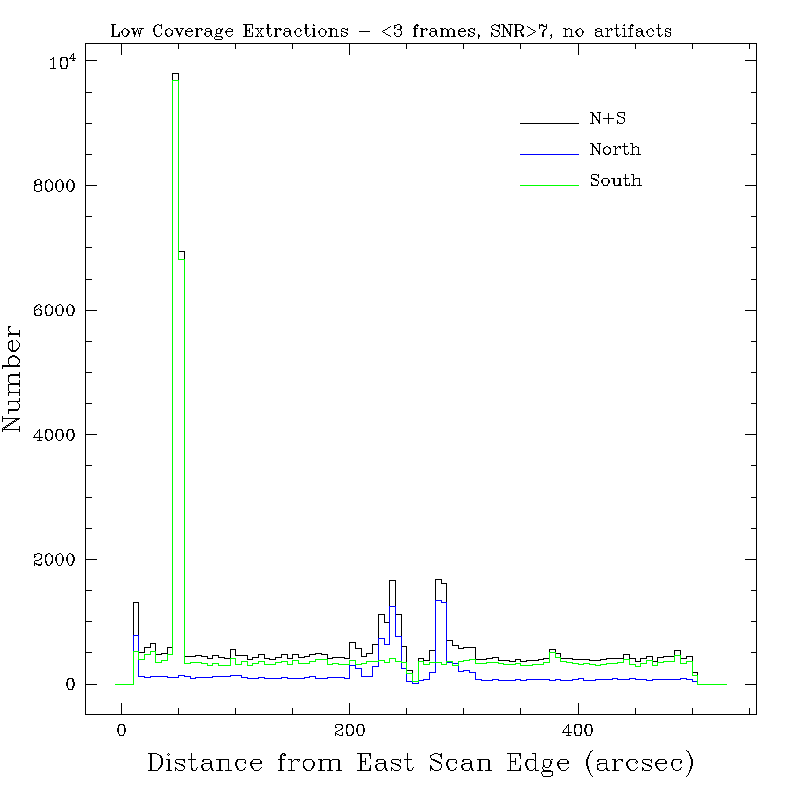 |
| Figure 2 |
The northern and southern distributions of characterized by relatively flat "background" low coverage distributions, punctuated by one or two peaks. The uniform background levels represent the random component of blanking due to transient events. The peaks represent fixed-pattern losses, due most likely to consistently masked pixels due to low sensitivity or high noise. The peaks near the center of the northern distributions are caused by the swarm of masked noisy pixels near the center of the Mt. Hopkins camera H-band array. That array degraded gradually over the course of the survey and was replaced during the 1999 summer shoutdown. The strong peak ~50" from the eastern edge in the southern distribution, is caused by several clumps of high dark current pixels.
II.3. Bands Detected
The number of "rd_flg" combinations for the 66,171 sources are given here, sorted by descending order of number of occurrences.
Seven out of the top twelve most common band-detection combinations involve 1-, 2- and 3-band R1 sources. H-band only, or H-band sources in inconsistent deblends are the other most commonly occuring combinations. Of considerable interest are the 580 3-band R1 sources, 303 3-band R2 sources, and 4 3-band saturated R1 sources. Such 3-band sources are usually considered highly reliable, and R1 and saturated R3 sources are bright.
3-Band Sources
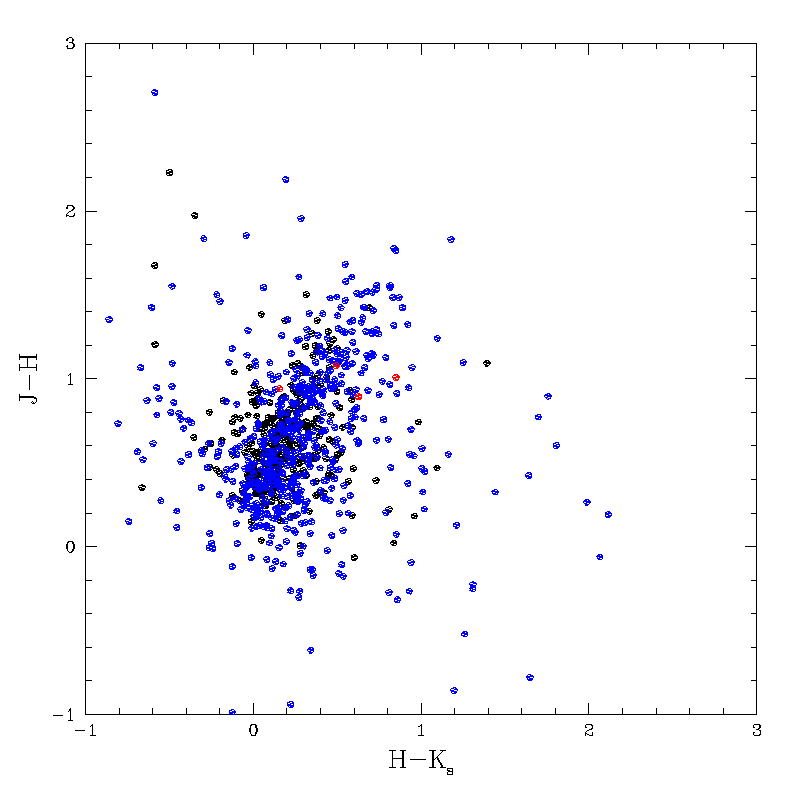
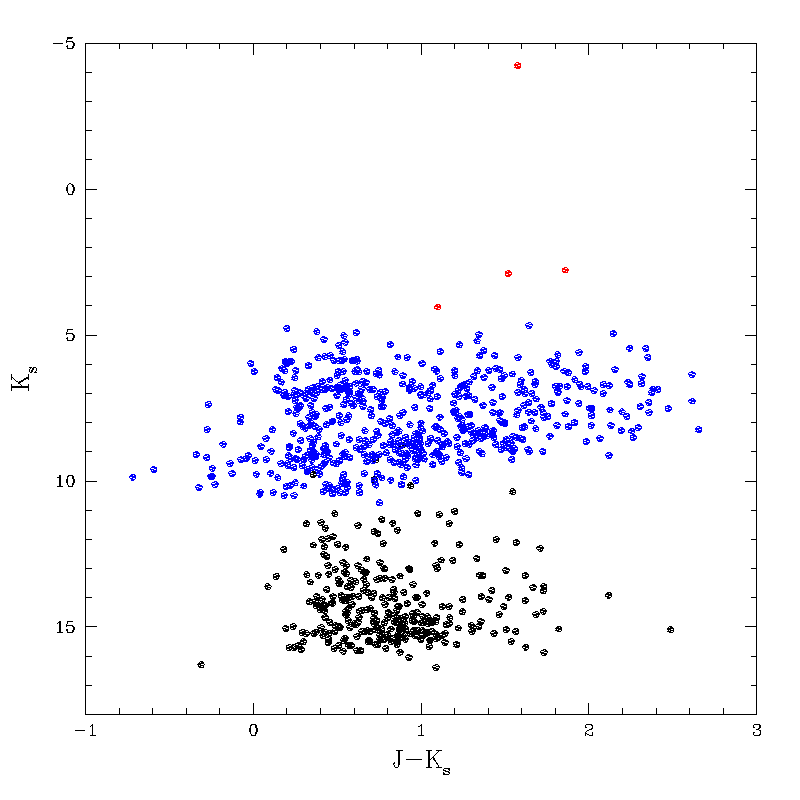
Figures 3a and 3b show color-color and color-magnitude diagrams for the 3-band, low coverage sources. In the three figures, R2 sources are shown as black points, R1 sources as blue points, and saturated R1 sources as red points.
 |
 |
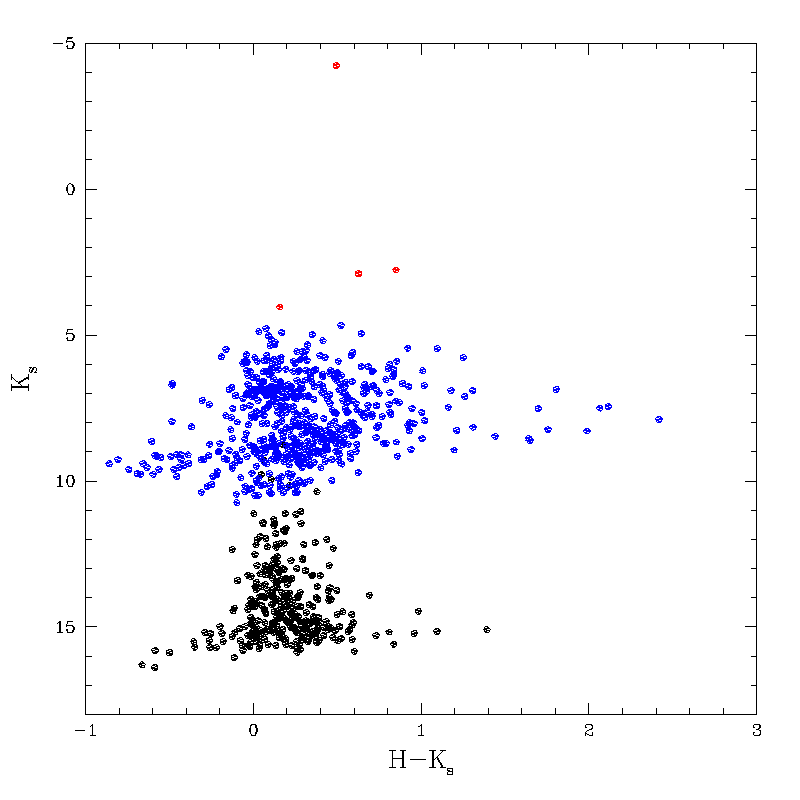 |
| Figure 3a JH vs. HK | Figure 3b JK CMD | Figure 3c HK CMD |
Three band detections are usually considered to be highly relible sources. Although the points in the color-color diagram generally follow the stellar locus, the scatter is large indicating the photometric quality of the low coverage points is poor. The 3-band R1 sources in particular show considerable scatter in the HK CMD.
Figure 4 contains a histogram of the distances from the east scan edges for the 303 low-coverage sources with rd_flg='222'. The majority of these extractions (258) are within <15" of the eastern scan edges. Examination of ~40 of these sources on the Atlas Images showed that they were all actually within just a few arcseconds scan edges. These are likely examples of scans were the great-circle interpolation between the reconstructed corners is off slightly due to scan wiggle. These objects should have been eliminated by the edge-distance source selection requirement, but since the dist_edge_ew values are too large, they are passed into the Catalog selection. Unless these nominally good detections are in scans for which there is insufficient overlap with adjacent scans, the sources on the sky should be recovered for the Catalog in the adjacent scans during duplicate resolution processing.
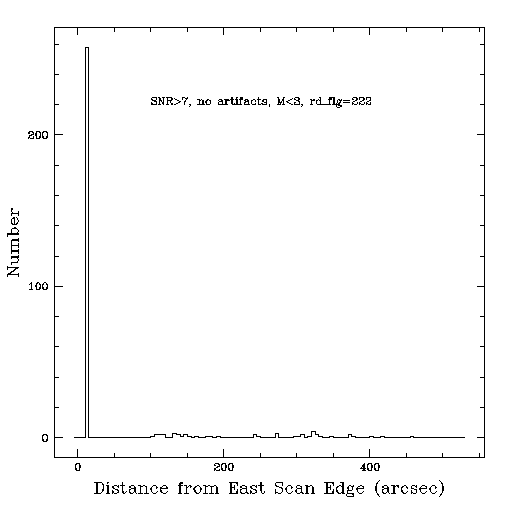 |
| Figure 4 |
An annotated list of the 45 low coverage sources with rd_flg='222' that are >15" of the eastern scan edges is provided here. These were examined on the Atlas Images and the classification is provided on the list. Twenty-three of these appear to be bonafide point-like or multiple sources. Of these "good" sources, a number lie on a diffraction spikes from very bright stars off the scan, a few are in the close vicinity of meteor trails that have been partially blanked, and a few are close double and triple sources. These can all account for the low coverage values. Twenty-two of the "sources" are a mixture of spurious detections on partially blanked meteor trails, diffraction spikes from bright stars off the scan, and a few just appear to be blank fields so there's no telling what triggered the detection.
One thing that distinguishes the good from bad in this set of 45 sources, is that the good sources all have N=2 and M=2 in at least one band (and often 2 or 3) while the bad sources have N<2, regardless of M. Recall these are sources that satisfy all of the other requirements of source selection except that they have low coverage (M<3). It may be that we can squeeze in sources down to M=2 if we require M=2 and N=2 in at least one band **and** 3-band detections. Recall that these sources meet all of the SNR, chi-squared, etc. requirements for source selection.
Bright M<3 Sources in South1 Catalog Generation Test Fields
There are 24 Point Source Working DB sources with rd_flg=1 or 3 only and have <3 frames on which measurements were possible in the South1 Catalog Generation Test Field. An annotated list of the low coverage R1 and saturated R1 sources is given here.
These are excluded in the current Catalog Generation DB source selection. Each of these sources was examined on the lossy compressed Quicklook Images and none were determined to be valid sources that should be in the catalogs. The majority of the objects (15/24) were confusion artifacts in the halo of bright stars; these all have cc_flg="c" in the detected bands, but should have had cc_flg="C". Three of the 24 low coverage sources are detections on an unblanked meteor trail in 981228s scan 014. Three of the 24 appear to be blank on the images. Two of the 24 are single-band detections of one component of close doubles; in these cases there is a good 3-band detection of the other component. These are not flagged as inconsistent deblend (rd_flg=6) because R1 sources are not deblended. Finally, one of the low coverage R1 sources was a non-fatally flagged persistence artifact (cc_flg="p") from a nearby bright source.
II.4. Split R1 Sources
Analysis of low coverage R1 and saturated R1 sources has revealed that a some may be caused by R1 frames extractions that fail to positionally "merge" in PFprep due to large R1 position residuals. Gene Kopan's web page describes this phenomenon that may be associated with slight in-scan telescope wobble or secondary "ringing."
R1 sources that fail to merge in PFprep are passed along in the pipeline as close multiple sources that cascade into problems for several subsystems. MAPCOR sees multiple bright sources in close proximity; the brightest of these will be used as a "parent" and the surrounding fainter occurrences will be flagged as artifacts. If the parent is bright enough (saturated in R1 or brighter than a fiducial saturation magntidue), the surrounding R1 detections will be fatally flagged (cc_flg="C"). If not, the fainter R1 detections will be flagged as non-fatal confusion sources (cc_flg="c"). BANDMERGE will combine only non-fatally flagged sources, and will preferentially combine non-flagged sources in the 3-bands. Thus, the merge failures in PFprep can result in the best information for some bright sources not being passed into the Catalog, or multiple bright sources being reported in unphysically close proximity.
The bad news and the good news: The bad news is that the best photometric and astrometric information will not make it into the Catalog for these sources, there can be extra detections of the same source that can appear in the Catalog, and in severe cases, bright sources may be inadvertantly filtered out of the Catalog with the combination of artifact and N/M filterring. The good news is that does not appear to be a very common occurrence so it may be possible to correct it with a database operation.
We are continuing to investigate this phenomenon to determine if a query can be devised that will find split R1 sources efficiently. At minimum, an effort should be made to identify these objects. If they are not too numerous, it may be possible to remerge the source information off-line and get the best information into the Catalog.
III. Minimum Number of Frame Detections
A source can fail to be detected at >3-sigma on individual frames for several reasons:
- The source is near or below the faint detection limit on the frames. The signal-to-noise ratio (SNR) of source measurements on single frames is ~2.4 times [sqrt(6)] lower than on the combined six frames. Therefore, frame detections should begin to be incomplete for sources ~1 mag fainter than the nominal survey completeness limits.
- A source is in a confused environment and not uniquely detected on each frame. This is particularly important for R1 sources which do not have passive deblending.
- A source is saturated in R1 on all frames. A special algorithm that fits the wings of the saturated source on the R1 frames is used for these objects.
The challenge for Catalog source selection is to find a frame detection fraction requirement that is high enough to filter out spurious detections of transient events, but low enough to not compromise completeness. For the Incremental Data Releases, sources brighter than 14.5, 14.0 and 13.5 mag in J, H and Ks, respectively, needed to be detection in >=41% of the frames on which they had measurements possible. This corresponds to allowable N/M combinations of 7/6, 6/7, 5/7, 4/7, 3/7, 6/6, 5/6, 4/6, 3/6, 5/5, 4/5, 3/5, 4/4, 3/4, 2/4, 3/3, and 2/3 (M<3 is not allowed). A simpler way to think of this is that for sources brighter than the frame detection completeness limits, one or two frame detections are considered low reliability.
III.1. Saturated R1 sources
A new feature of final 2MASS processing is brightness estimation for saturated R1 sources. For these cases, the value of N is always set to "0" because the formal definition of N carried over from preliminary processing was the number of non-saturated frames on which measurements were possible. This definition was not adjusted in 2MAPPS v3.0. Thus, the query to exclude low N sources must be adjusted to avoid inadvertantly eliminatinge saturated R1 sources.
Sources that are near the R1 saturation limit often have some saturated and some non-saturated frames depending on seeing fluctuations and where a source centroid falls relative to pixel boundaries. In those cases, the quoted measurement is taken from the R1 aperture photometry made on the non-saturated frames, leading to low values of M (see above) and N.
III.2. Source Count Evolution with N/M
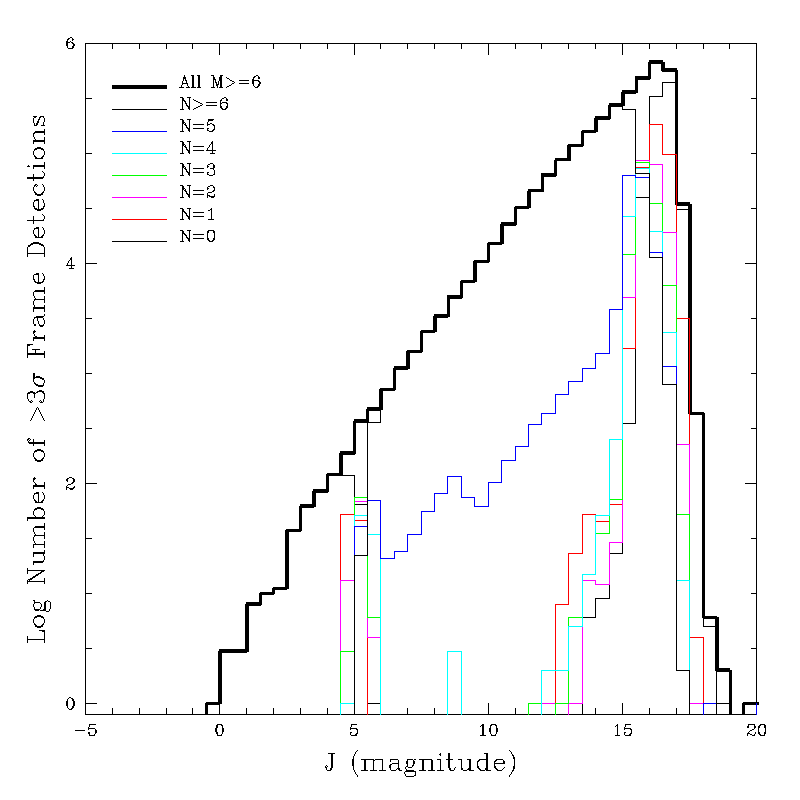
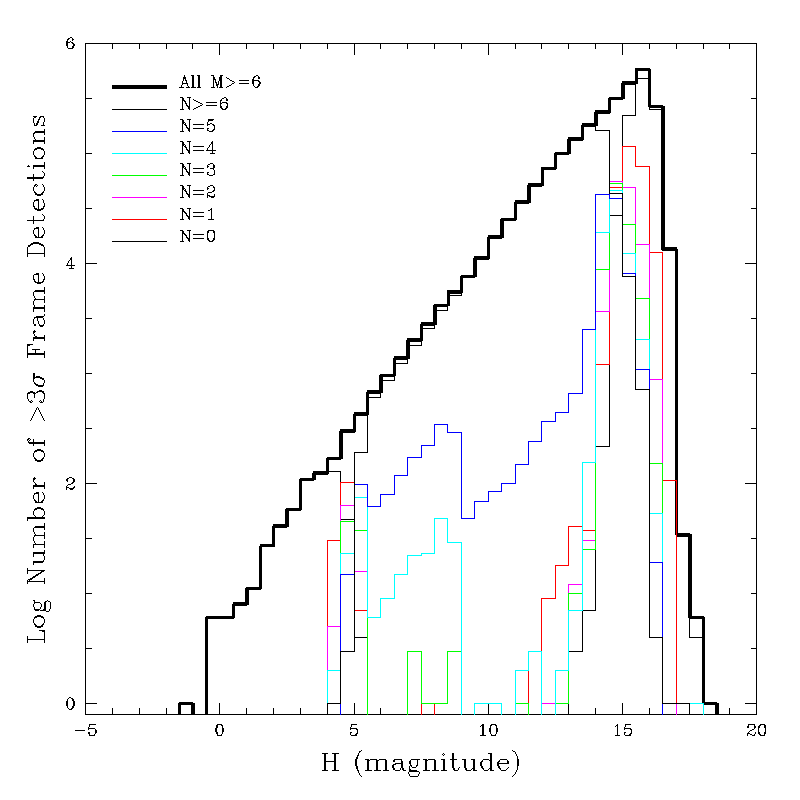
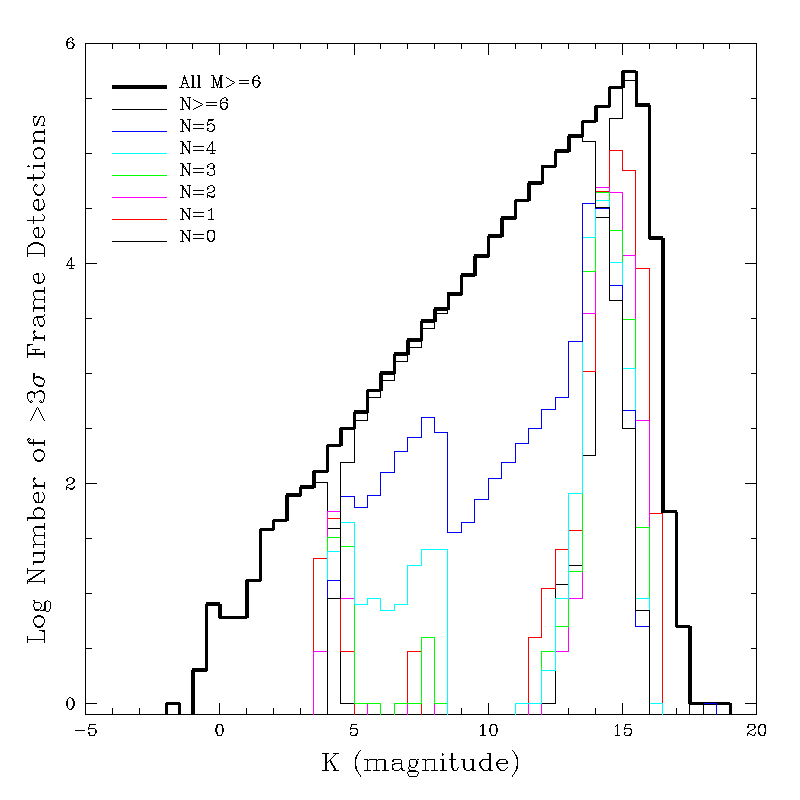
Figures 5a-5c are whirlgifs that show how the |b|>70o (section II.1) source counts in J, H and Ks, respectively, evolve with decreasing numbers of detections, N, for different values of M. Each panel in the movies shows the distributions for a specific value of M, and the curves for different values of N are shown in a different color on each panel. The Log N-Log M for the all sources with a given M are shown as heavy black lines (these correspond to the curves plotted in Figures 1a-c). The distributions for sources with >6, 5, 4, 3, 2, 1 and 0 frame detections are shown by the thin solid black, blue, cyan, green, magenta, red and dashed black lines, respectively. The number of curves decreases with decreasing M since it is not possible to have more detections than frames.
 |
 |
 |
| Figure 5a J-band |
Figure 5b H-band |
Figure 5c Ks-band |
III.3. Frame-Detected Fraction as a Function of Brightness
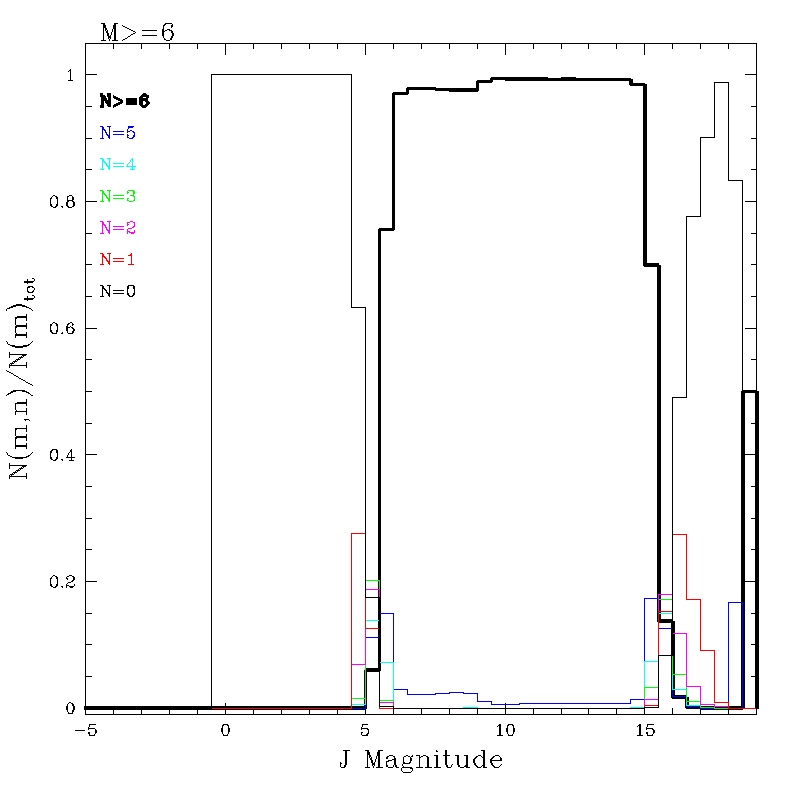
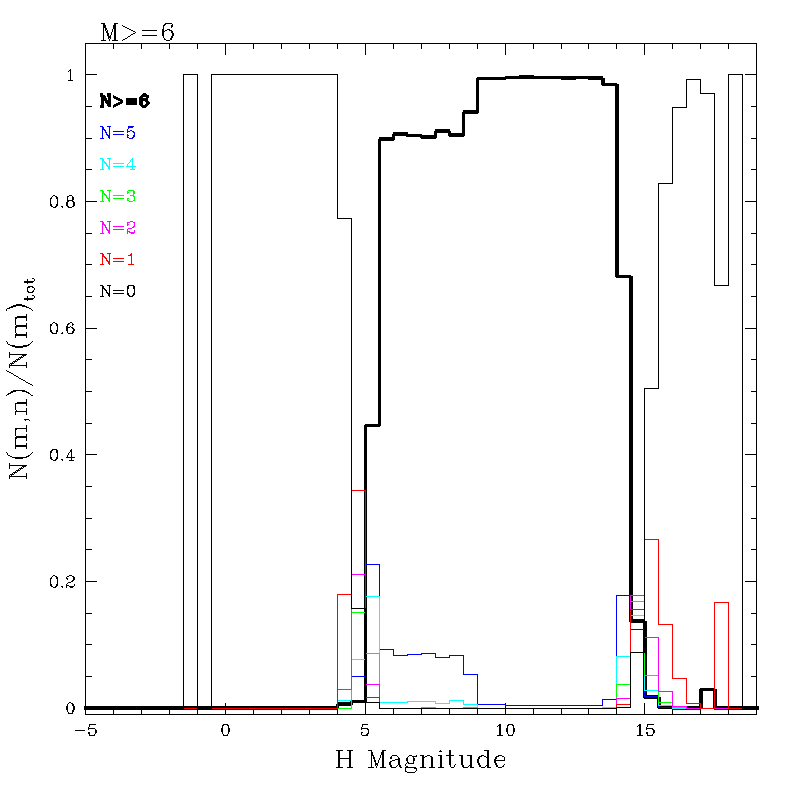
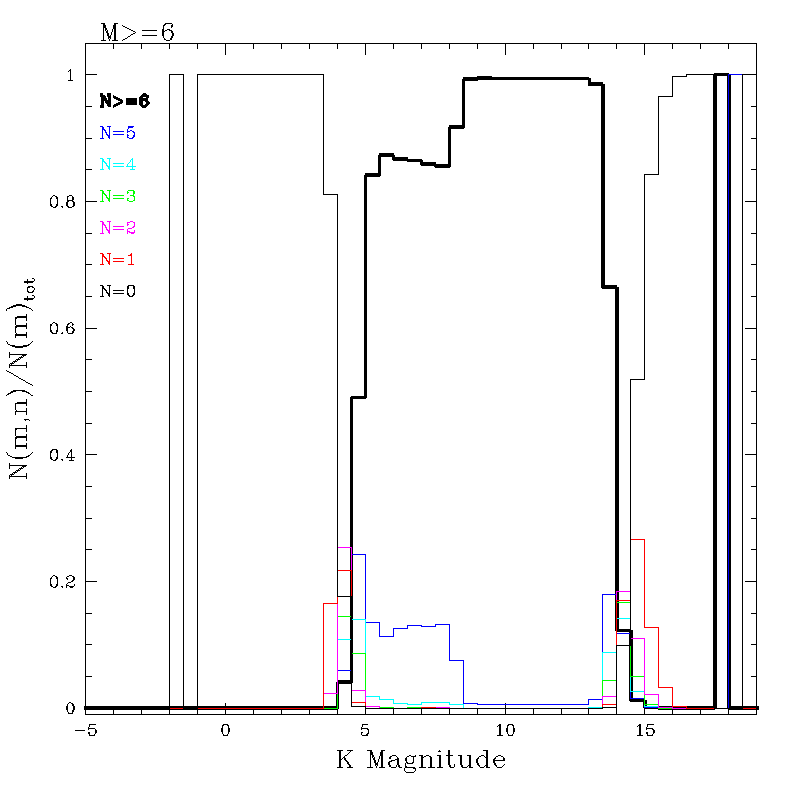
The detected fraction for the M>6 case is presented in a slight different way in Figures 6a-6c. These figures show the fraction of sources detected in N=0-6 frames for all M=6 J, H and Ks sources in the |b|>70o sample discussed in section II.1.
 |
 |
 |
| Figure 6a J-band |
Figure 6b H-band |
Figure 6c Ks-band |
The detected fractions show that the majority of sources fainter than R1 saturation and the survey nominal completeness limits are detected in essentially all frames. The N<6 distributions show peaks below the completeness limit and near the R1 saturation limit, as expected. The faint N<6 peaks reach minimum values close to J-14.5, H=14.0 and Ks=13.5, corresponding to the faint magnitude limits used for the N/M test.
A Bookkeeping Error in R1 M-values
The N=5 curves in Figures 6a-6c show surprising plateaus in the 5-9 magnitude range for all bands, corresponding to the R1 regime, and there are indications of much smaller plateaus for N<5. However, these plateaus are not caused by a large number of missing R1 frame detections but rather by a bookkeeping oversight in how the number of measureable frames is tabulated in PFprep.
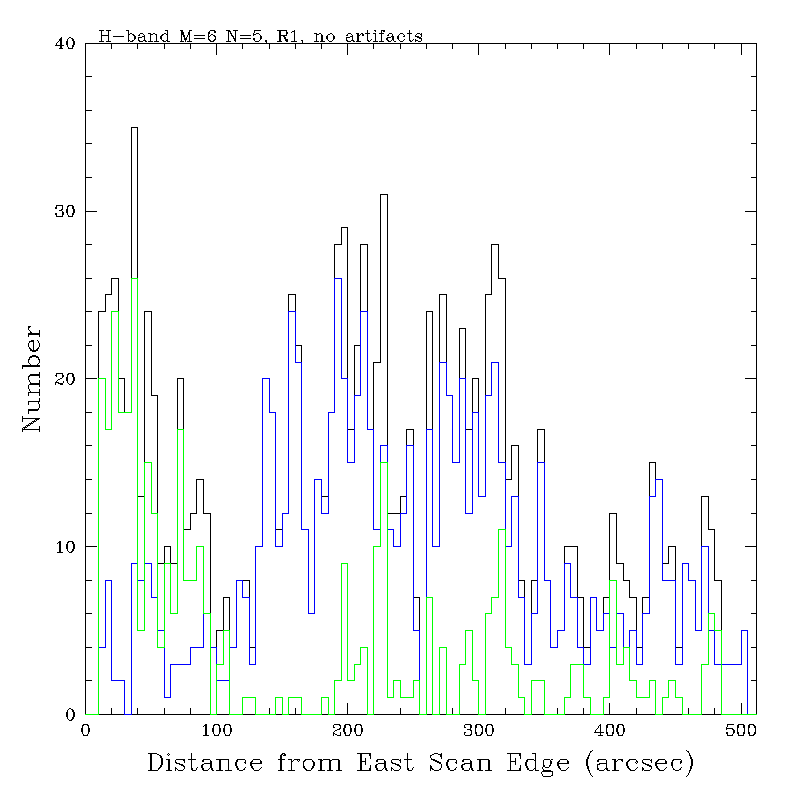
Frame extractions are passed to PFprep to be positionally "merged" into groups of measurements of the same source. PFprep computes the number of possible frames available for measurement (M) by subtracting the number of extractions that are marked as bad or saturated from six (M = 6 - Nbad). A frame extraction is marked as bad or saturated only if during the frame aperture photometry a masked or saturated pixel is found within a 4" radius of the centroid. However, a frame extraction that has a masked pixel within 3" of its centroid will be rejected outright, will not be aperture-photometered, and will not be passed to PFprep. Thus, PFprep will not subtract out most of the real masked extractions and will systemmatically overcount M for sources with one or more "bad" frame extractions. Therefore, the majority of the N=5 R1 sources in the M=6 distributions in Figures 6a-6c are really N=5 and M=5 sources.
Figure 7 shows the distribution of N=5 and M=6 R1 H-band sources from the high latitude subset. As in Figure 2, the blue line is the distribution for northern sources, the green line is for southern sources and the black line is the sum of north and south. The broad peak in the distribution of northern sources near the center of the northern array and the peak near the eastern edge of the southern array confirm that the frequency of overcounted M is coincident with the area with the greatest concentration of masked pixels.
 |
| Figure 7 |
Last Updated: 7 March 2002
R. Cutri - IPAC