Cross-Scan Distributions of Single-Band Sources in the PSC
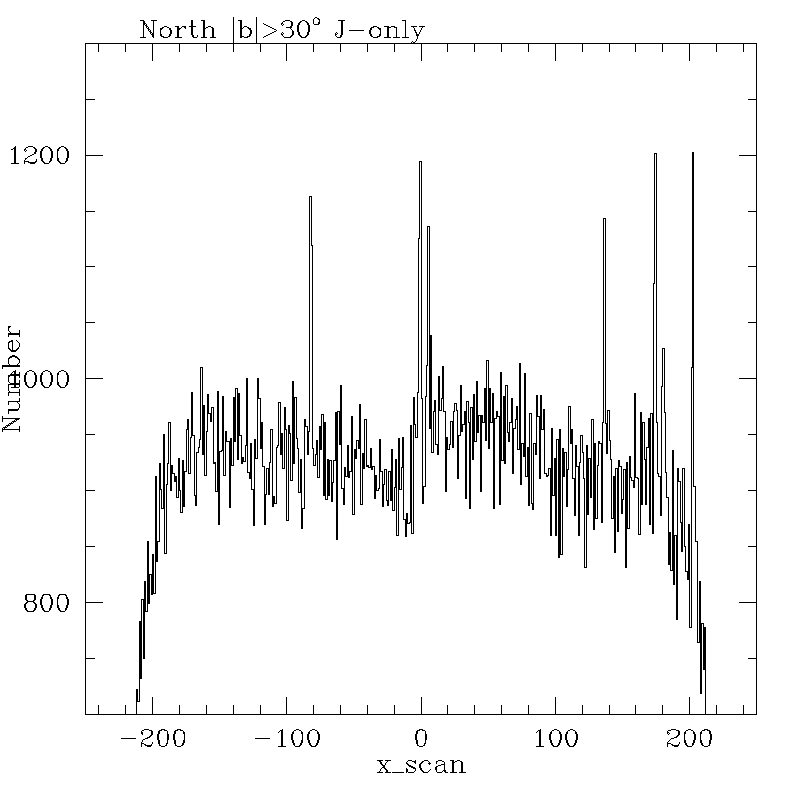
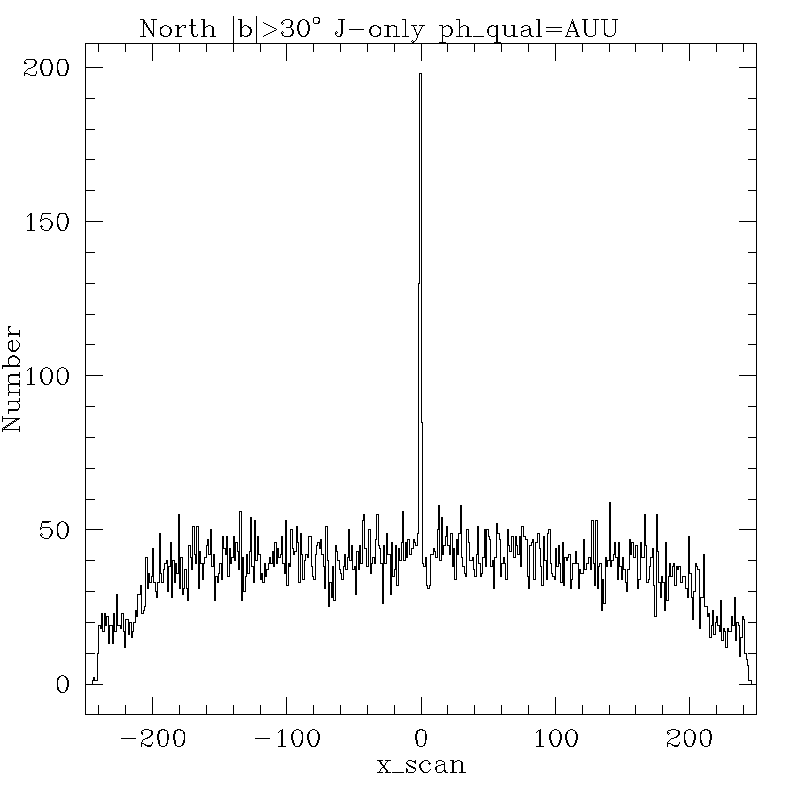
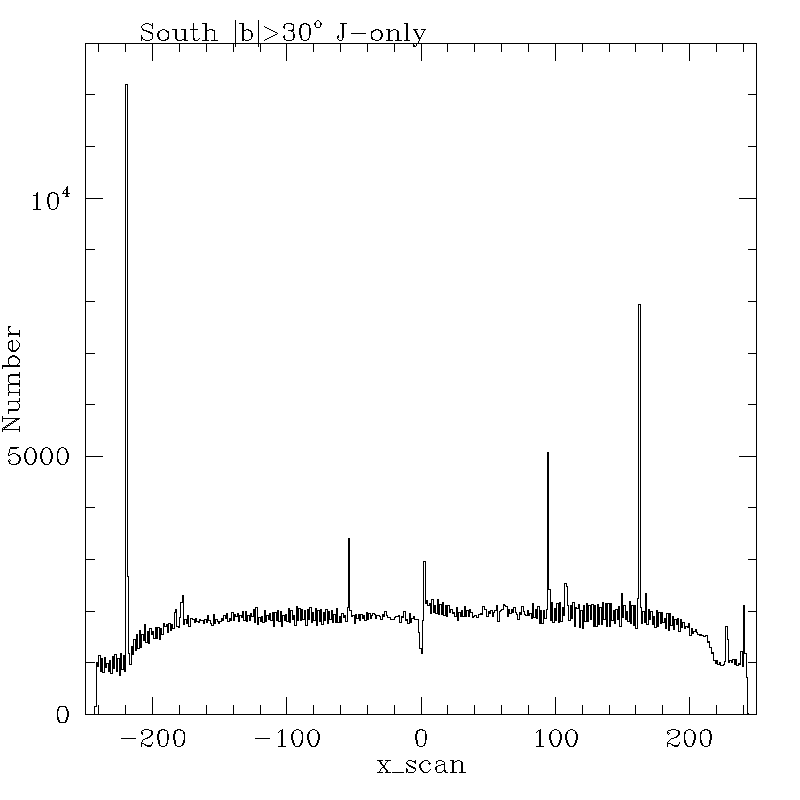
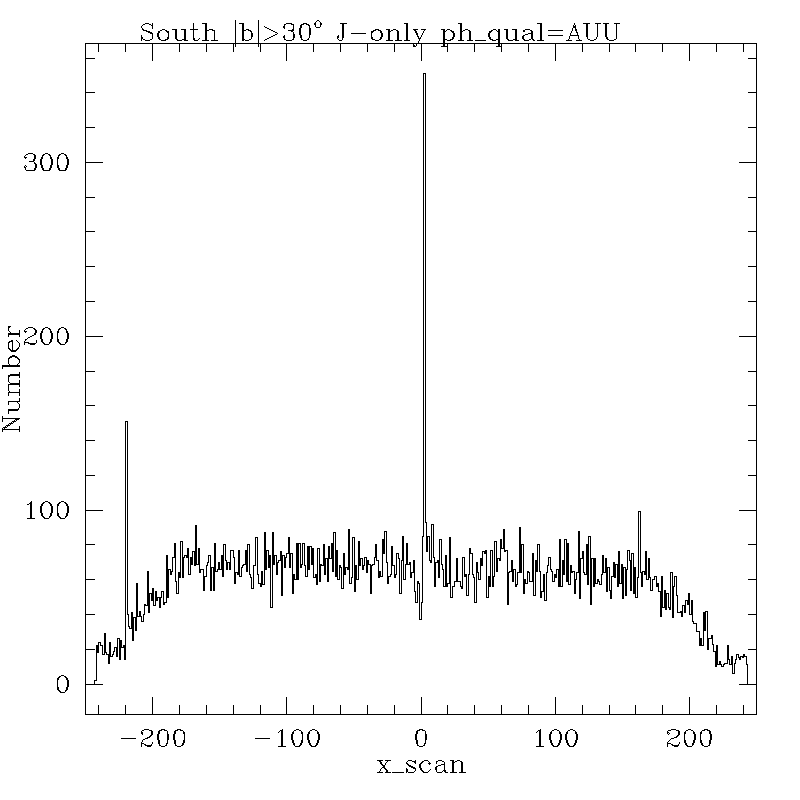
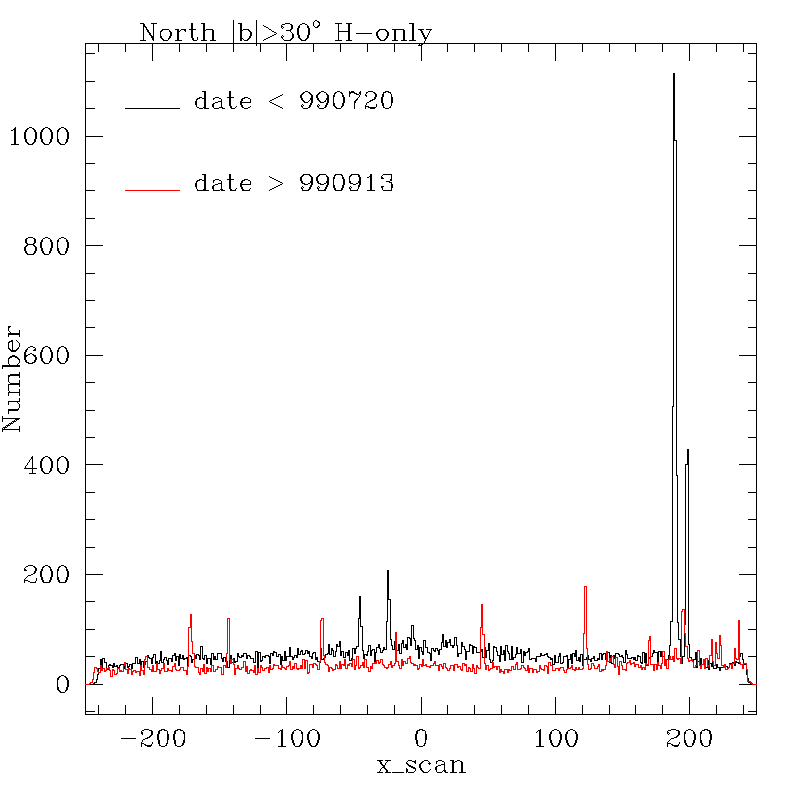
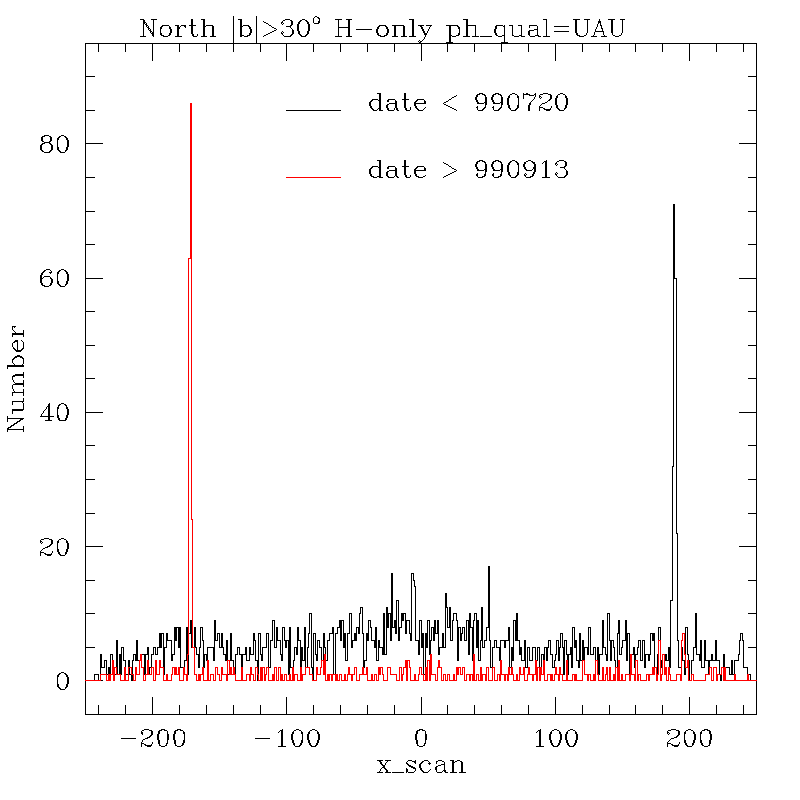
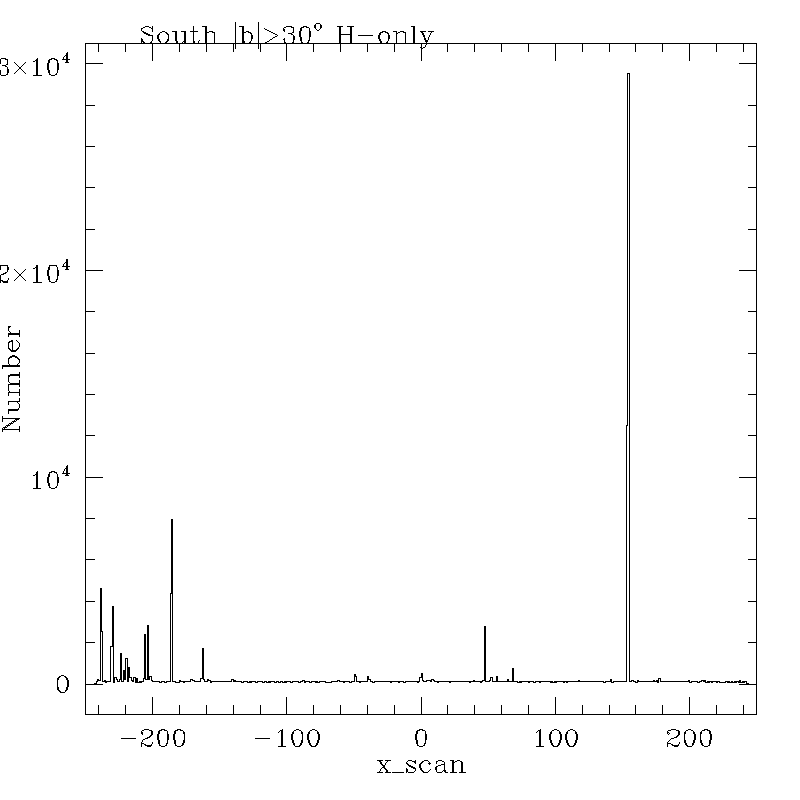
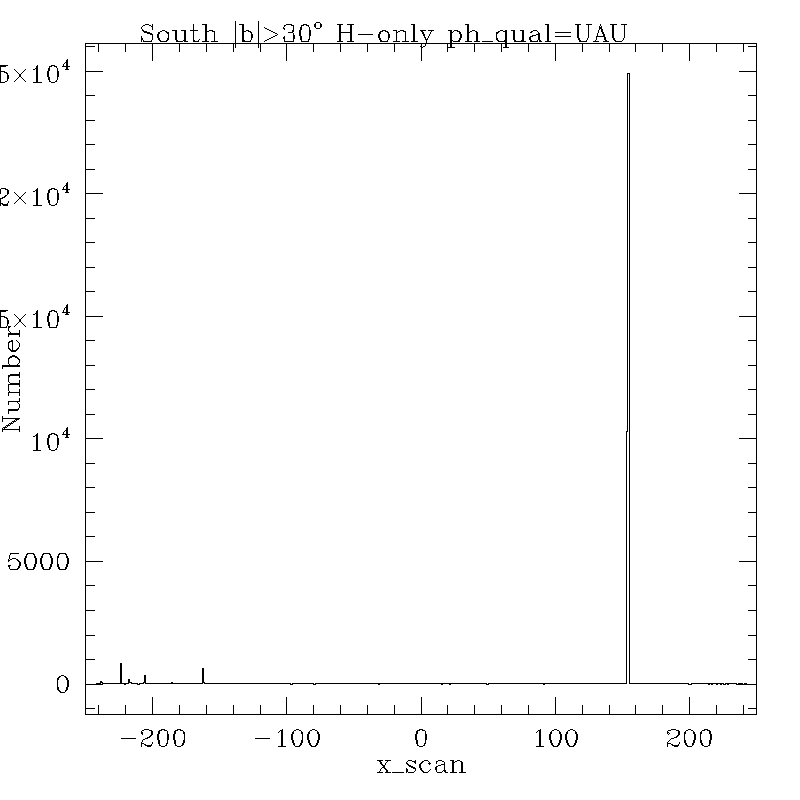
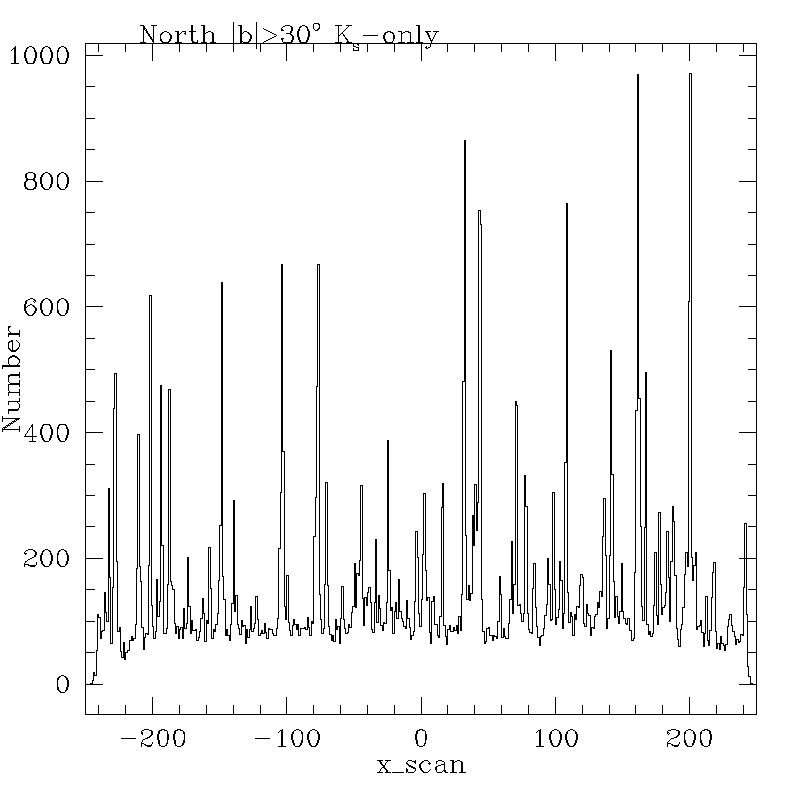
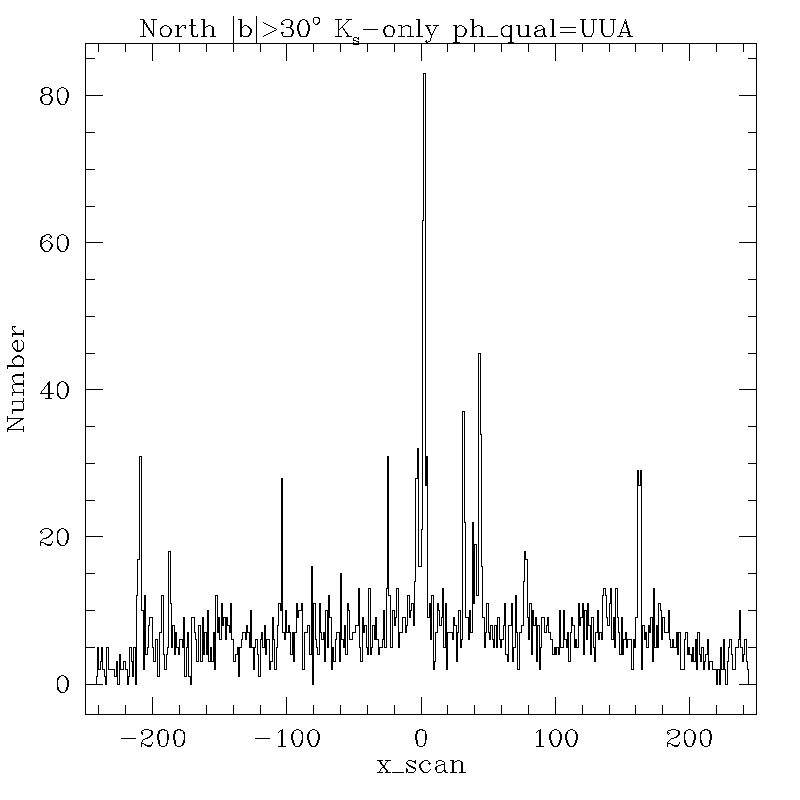
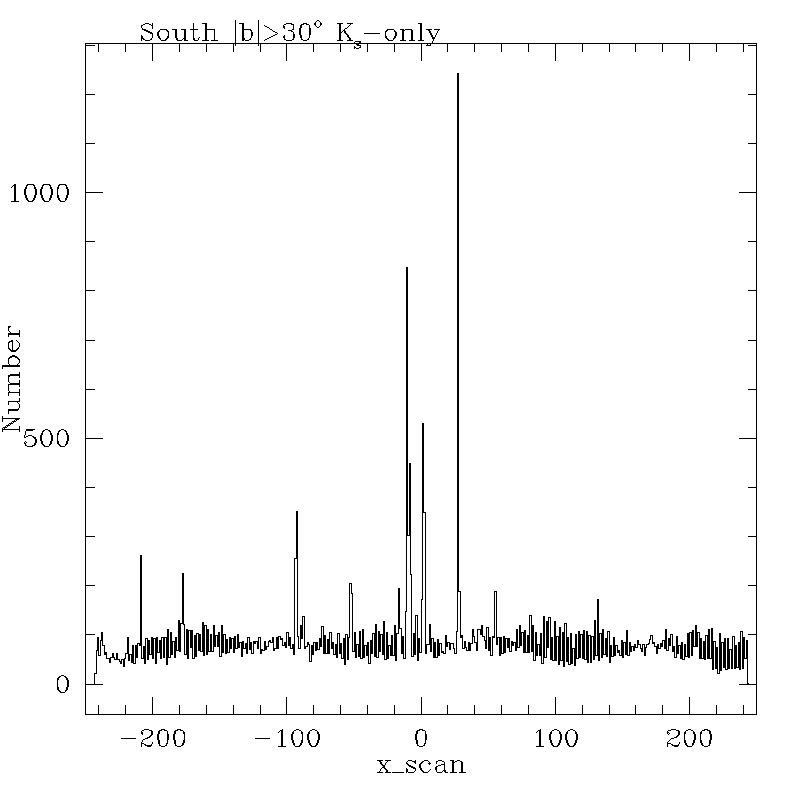
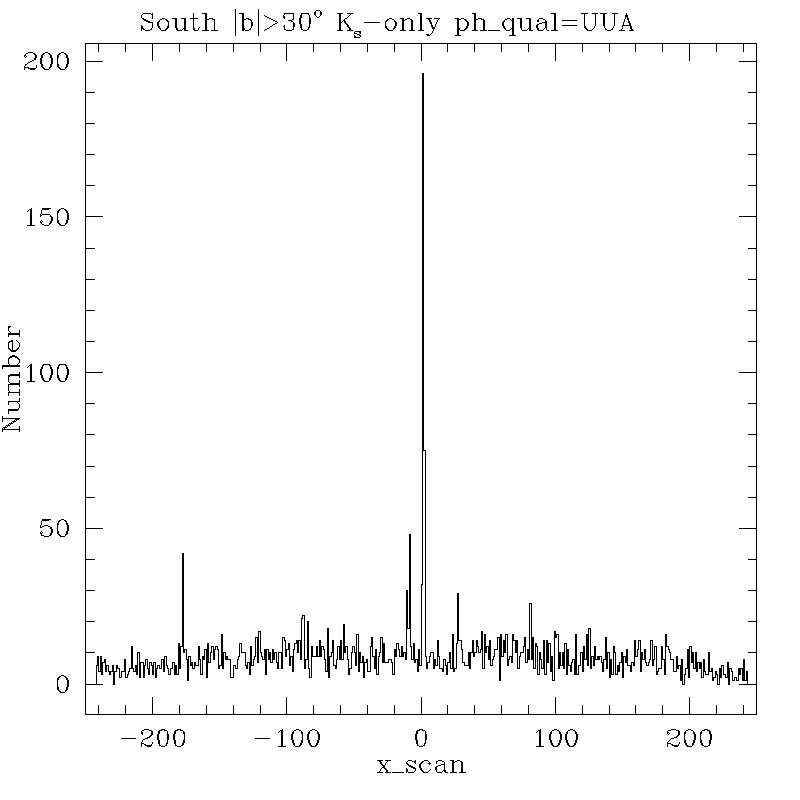
Figures 4-9 show the distribution
of cross-scan positions (x_scan) for the single-band sources in
the high latitude PSC. For each band, each hemisphere is plotted
separately, and for each hemisphere, the distributions for all
sources and sources with ph_qual='AUU' are shown.
 |
 |
 |
 |
| Figure 4a - J-only North |
Figure 4b - J-only North ph_qual='AUU' |
Figure 5a - J-only South |
Figure 5b - J-only South ph_qual='AUU' |
 |
 |
 |
 |
| Figure 6a - H-only North |
Figure 6b - H-only North ph_qual='UAU' |
Figure 7a - H-only South |
Figure 7b - H-only South ph_qual='UAU' |
 |
 |
 |
 |
| Figure 8a - Ks-only North |
Figure 8b - Ks-only North ph_qual='UUA' |
Figure 9a - Ks-only South |
Figure 9b - Ks-only South ph_qual='UUA' |
[Last Updated: 2002 November 19; by R. Cutri]
Previous page. Next page.
Return to Explanatory Supplement TOC Page.


