VI. Analysis of the 2MASS All-Sky Data Release
1. Global Photometric Properties
a. Point Source Catalog Photometry of 2MASS Calibration Stars
i. Summary
The set of standard stars developed to calibrate 2MASS survey define a nearly-independent "truth-set" that has been used to analyze the uniformity of photometry in the Point Source Catalog. The results of that analysis are as follows:
- On average, there is no measureable bias between the "true" standard star magnitudes and the magnitudes reported for these stars in the PSC. The characteristic dispersion of the differences in each band is 0.024 mag in J, 0.023 mag in H and 0.025 mag in Ks.
- There is no evidence for biases larger than 1-2% in the differences between "true" and PSC photometry as a function of source brightness, right ascension or declination. There are individual outliers with residuals larger than what are expected based on the the PSC photometric uncertainties, assuming Gaussian statistics. These residuals are usually correlated between bands, with some exceptions. The most extreme offset between "true" and PSC photometry is for the J-band measurement of one star, BRI0012-024. The offset is caused by contamination of the j_band image by a transient "source" that may be a cosmic ray strike. A second survey measurement of the this star, not selected for the PSC, does not show the J-band offset.
- There is a suggestion of a weak color-dependent bias between the "true" and PSC photometry of the standards. However, most of the reddest stars in the sample, which drive the marginal correlation, all come from one calibration field, 90547. This is a high source density field with a large amount of foreground extinction. Photometry of this field was consistently problematic during the survey, possibly because of the presence of variables. Red standards from other fields, such as 90009 (Oph n9), do not show a systemmatic difference between the "true" and PSC magnitudes.
- There may be a weak photometric bias on profile-fit photometry chi-squared, in the sense that the large the chi-squared value, the fainter the PSC magnitude is relative to the "true" magnitude. This bias is not related to focal plane distortion, but may be associated with factors that affect individual measurements such as seeing variations, cosmic ray hits, confusion, etc. This effect would be better studied using the highly repetitive measurements of stars in the calibration fields.
ii. 2MASS Standard Stars
2MASS photometric calibration was conducted in final data processing by deriving and applying transformations derived from hourly observations of one of 36 calibration fields. Over the course of the survey, between 600 and 3500 independent scans of each calibration field were accumulated. Each field contains between 8 and 44 standard stars that were selected at the completion of preliminary data processing to be high signal-to-noise Read_2 sources (9<J<14, 9<H<13.5, 9<Ks<13), to be within the central cross-scan half of the fields to minimize field-edge distortion effects, to be free from confusion with nearby sources or artifacts and to show no evidence of time variability. Magnitudes with a high degree of internal consistency in the 2MASS system were derived for the standard stars using a global chi-squared minimization analysis applied to the 600 to 3500 independent measurements of each star. This photometry of the 958 standard stars in the 36 calibration fields is probably the closest thing to a large, "independent" truth table that exists for 2MASS PSC photometry.
The identifiers, positions and "true" magnitudes of the 958 2MASS calibration stars is given in Table 1.
All of the 2MASS standards were also observed during normal survey observations, and the survey measurements were calibrated using the nightly photometric transformations derived from many calibration field observations. In this analysis, we compare the PSC photometry of the standard stars (Mpsc) to their "true" magnitudes (Mcal), derived from the chi-squared minimization of all calibration scan measurements, to test the uniformity of calibration applied to the survey, as well as a other characteristics of PSC photometry.
iii. Global Properties of the Photometric Residuals
PSC photometry for the 958 standards was obtained by extracting sources in the Catalog within a 5" radius around each standard's position. Matches were found for all 958 stars, and in no case was there more than one matching PSC source found within the 5" radius. All 958 matching PSC sources have rd_flg='222', ph_qual='AAA', bl_flg='111', mp_flg='0' and gal_contam='0'. Four of the stars have cc_flg values other than '000'. These other values are:
Star        cc_flg
s90813_29   '00c'
s90312_32   '00s'
s90533_12   '0s0'
s90279_24   'sss'
These stars are completely normal in appearance in the images, in photometric residuals, and all other parameters, so they are left in for this analysis.
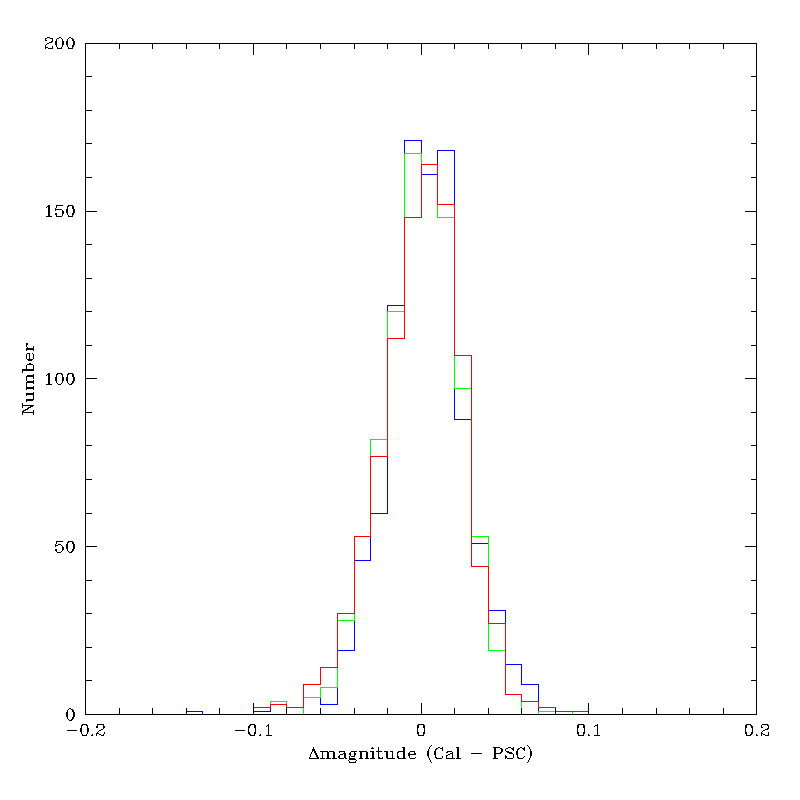
Mean Residuals
Figure 1a shows histograms of differences between J, H and Ks magnitudes for the calibration stars. Figure 1b shows the magnitude differences in each band plotted against one another (lines are unit slope are shown for reference). The mean and RMS magnitude differences (Mcal-Mpsc) in each band for the full set of standards are given in Table 2. The statistics are also broken out for stars observed in just the northern and southern observatories. There is no net difference between true and PSC magnitudes for the full set of standards, or from the observations from each hemisphere.
The magnitude residual distributions shown in Figure 1b are elongated slightly along the unit slope lines, indicating that the magnitude residuals correlate band-to-band. However, there are notable exceptions that are offset in the orthogonal directions, that represent variations in individual bands for a source.
Table 2 - Mean and RMS Magnitude Differences For Calibration Stars
| All | North | South | ||||
|---|---|---|---|---|---|---|
| Band | < Mcal-Mpsc > | RMS | < Mcal-Mpsc > | RMS | < Mcal-Mpsc > | RMS |
| J | 0.0241 | 0.0214 | 0.0256 | |||
| H | 0.0233 | 0.0238 | 0.0230 | |||
| Ks | 0.0252 | 0.0246 | 0.0253 |
 |
 |
| Figure 1a Mag Residual Histograms | Figure 1b Mag Residuals Band vs. Band |
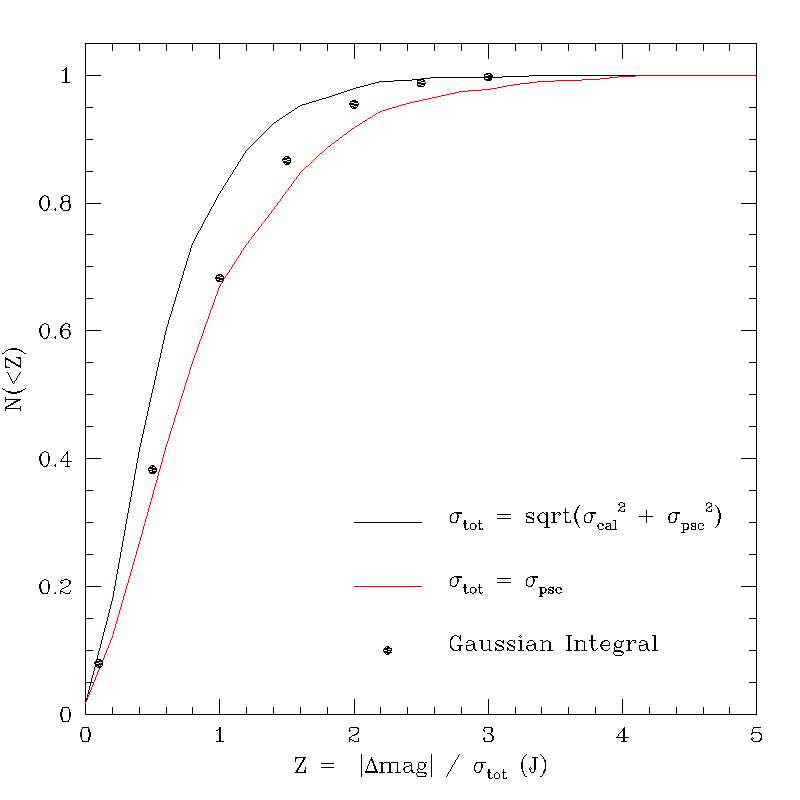
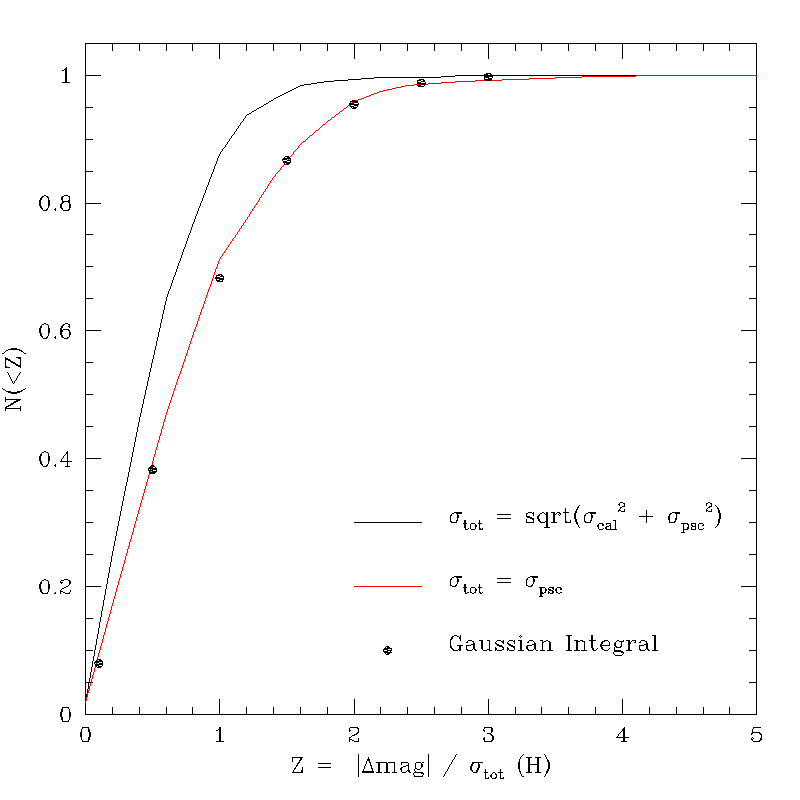
Are the distributions shown in Figure 1 consistent with statistical measurement uncertainties? In Figures 2a, 2b and 2c are shown the cumulative distributions of the magnitude difference scaled by the uncertainties in J, H and Ks, respectively, for all of the standard stars. The black curves show the cumulative distributions scaling each magnitude difference by the root-sum-square of the magnitude uncertainties from the globabl chi-squared minimization and the PSC ?_cmsig values. The red curves show the distributions scaling the magnitude differences by only the PSC ?_cmsig values. For reference, a Gaussian Integral distribution is also shown on each plot.
The error distributions scaled with only the PSC ?_cmsig values are much closer to the Gaussian distributions in all bands. The H-band residuals are surprisingly well-fit by the Gaussian, but there are significant excesses in the wings of the J and Ks distributions.
 |
 |
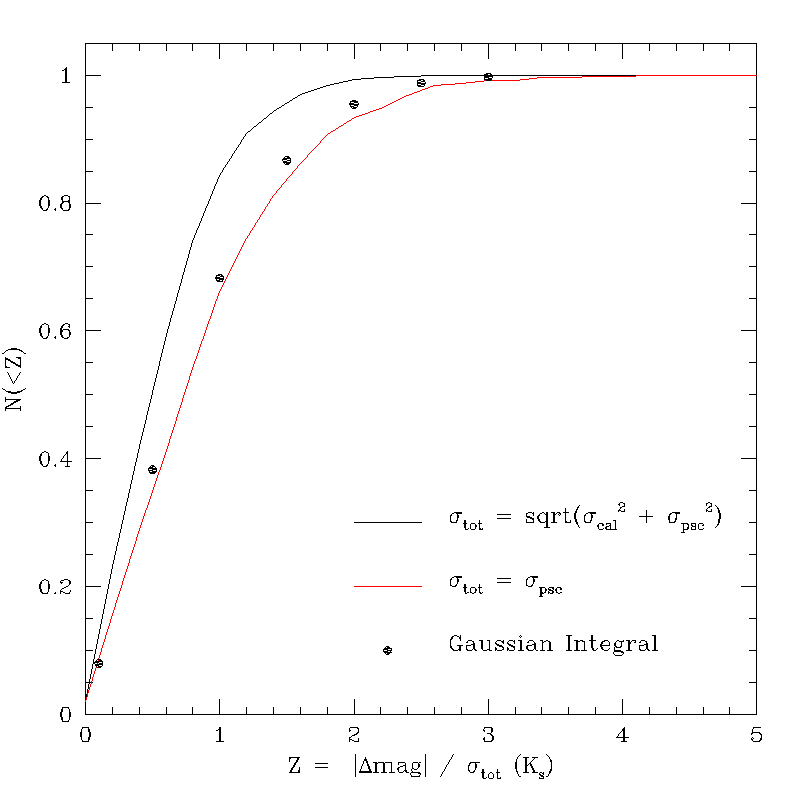 |
| Figure 2a J Residual Probability Dist. | Figure 2b H Residual Probability Dist. | Figure 2c Ks Residual Probability Dist. |
Brightness and Color Dependencies
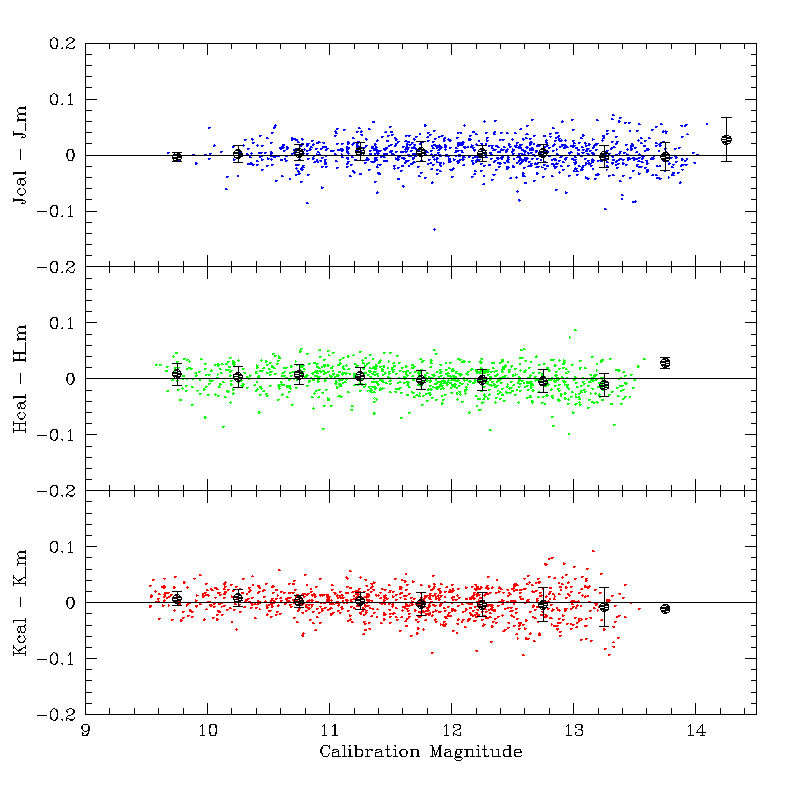
The PSC magnitude residuals are plotted as a function of "true" magnitude for each star in Figure 3. The small, blue, green and red points show the residuals for individual stars in J, H and Ks, respectively. The larger black points and errorbars represent the 2-sigma trimmed-average and RMS of the residuals in 0.5 mag bins. There are no significant magnitude-dependent biases in the residuals. There is a slight increase in RMS towards the faint end of the Ks distribution, indicating that those stars reach into the background photon-limited regime.
 |
| Figure 3 Mag Residuals vs. Mag |
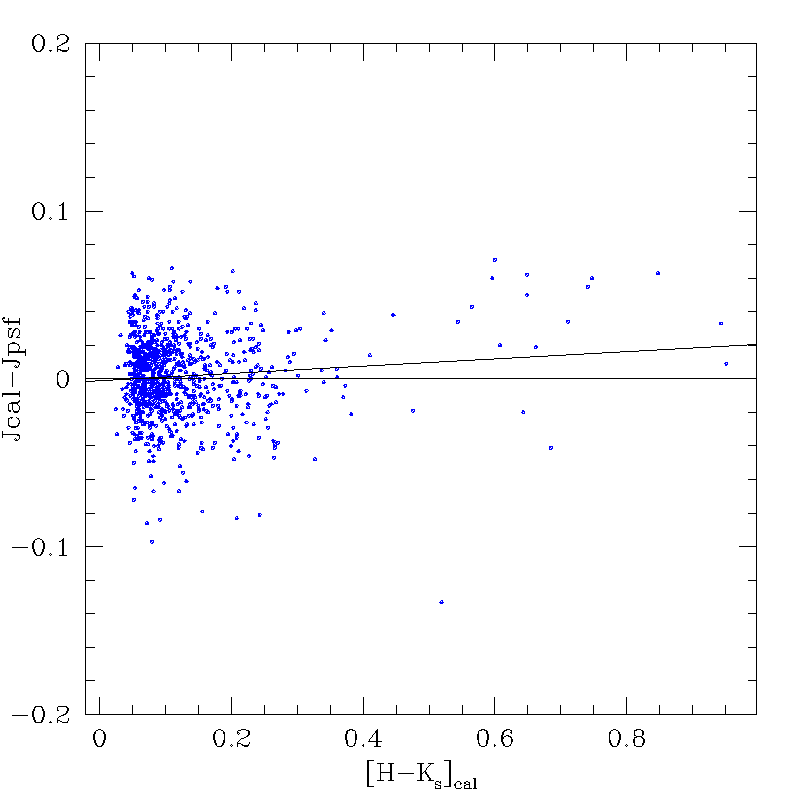
Figures 4a, 4b and 4c contain plots of the magnitude residuals in each band versus the independent color (i.e. Jcal-Jpsc vs. [H-K]cal). These figures suggest that there is a weak color-term in the residuals, but this is biased by the small number of very red sources.
Linear fits to the magnitude differences as a function of color were made using the BCES generalized ordinary least squares technique of Akritas & Bershady (1996 ApJ, 470, 706). This technique takes into account the measurement errors on both axes and intrinsic scatter in the relationship. Table 3 contains a listing of the BCES linear fit coefficients and their uncertainties, and the fits are overplotted in Figures 4a, 4b and 4c.
Table 3 - Linear Coefficients and Uncertainties for Dmag = A + B*Color
| Fit | B | sigma B | A | sigma A |
|---|---|---|---|---|
| DJ vs. [H-Ks]cal | 0.215E-01 | 0.131E-01 | -0.825E-03 | 0.160E-02 |
| DH vs. [J-Ks]cal | 0.627E-02 | 0.229E-02 | -0.469E-02 | 0.151E-02 |
| DH vs. [J-H]cal | 0.463E-02 | 0.320E-02 | -0.266E-02 | 0.166E-02 |
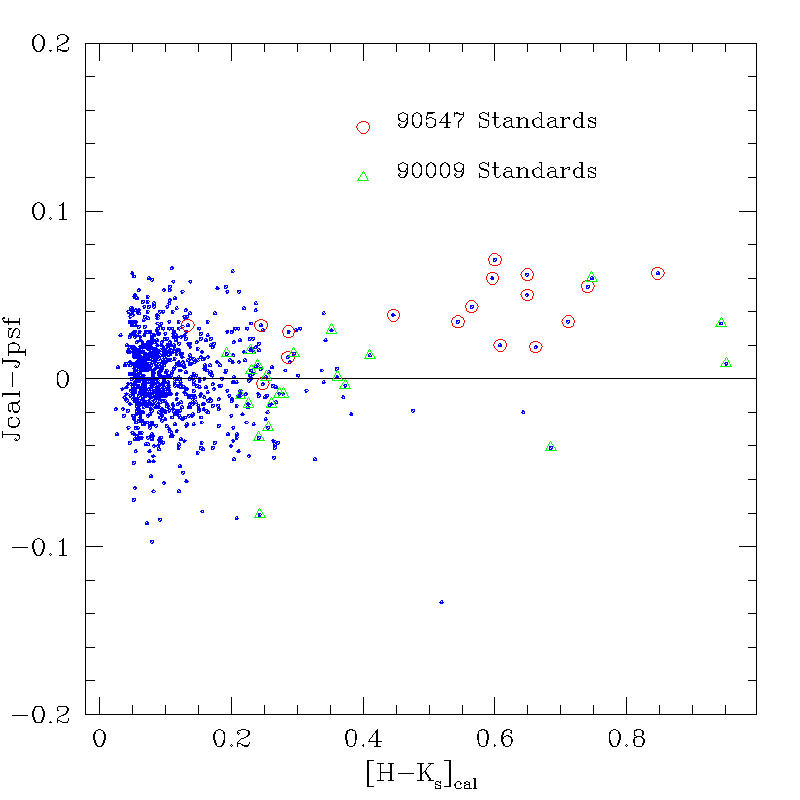
None of the slopes on the linear fits differ from zero by more than three times the uncertainty, so the significance of the trends is questionable. The reddest 2MASS standards fall in two fields, 90547 (centered on Lynds 547) and 90009 (centered on Oph n9). The majority of these come from 90547, and as shown in Figure 5, the 90547 all have systematically large, positive residuals. Photometry of the 90547 field was problematic during the survey. The field has a high source density, a large amount of foreground extinction (hence the large number of red stars), and a number of variables. Because the apparent color bias is of low statistical significance and arises primarily from the stars in one field, we do not believe there is a real effect.
 |
 |
 |
 |
| Figure 4a DJ vs. H-Ks | Figure 4b DH vs. J-Ks | Figure 4c DKs vs. J-H | Figure 5 DJ vs. H-Ks annotated |
Spatial Dependencies
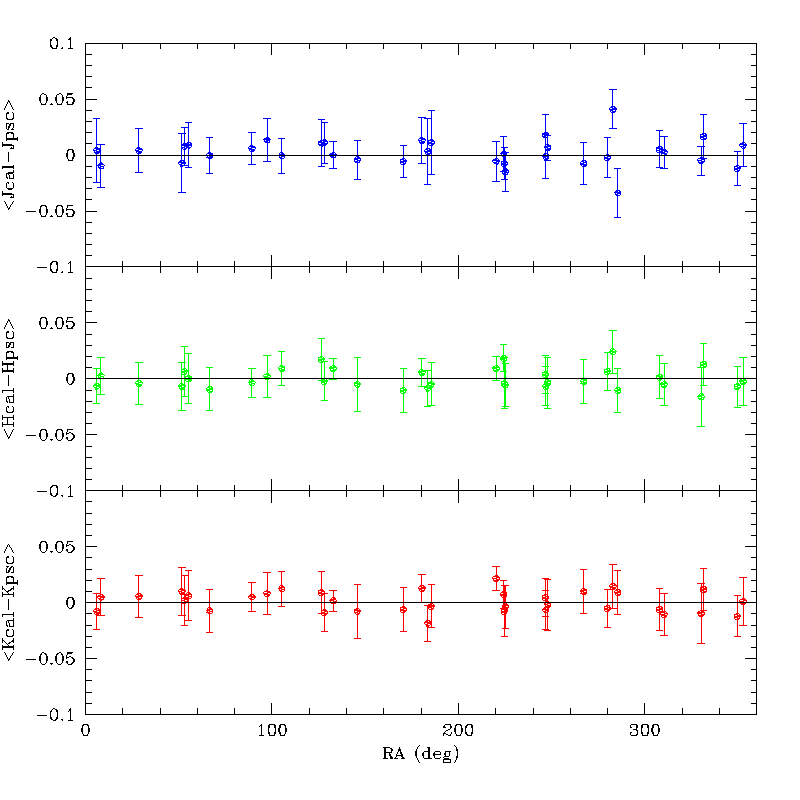
The 2MASS calibration fields are distributed uniformly in RA around the sky, and broadly over declinations between +60°, so they can be used to probe spatial variations in the survey calibration. Figures 5 and 6 shows the trimmed average standard star J, H and Ks magnitude residuals in each field, plotted as a function of the mean right ascension and declination of the field, respectively. The error bars represent the RMS of the residual in each field. There are no systemmatic trends with sky position, but there are a few fields that show >1-sigma deviations from zero offset. The most significant is the 90547 field at RA~280° and DEC~-4280°.
 |
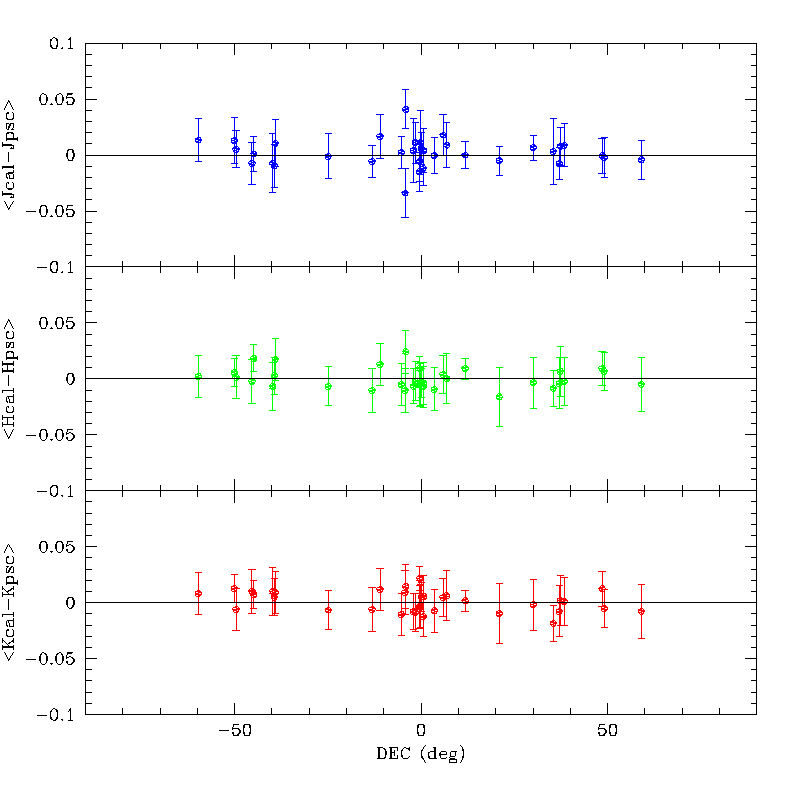 |
| Figure 6 Dmag vs RA | Figure 7 Dmag vs. DEC |
Time Dependencies
Figure 8 shows the differences between "true" and PSC magnitudes plotted as a function of the sequential survey day on which each star was observed in survey scans. As before, the small black points represent individual stars, and the large color points are the trimmed average residuals in two day bins. There are no systematic trends with time. However, there are individual stars and groups of stars with relatively large residuals. Most standards in a given calibration field were observed on the same day in survey scans, but this was not always the case. Some, but not all, of the apparent outliers in Figure 8 are bins containing only one or two stars.
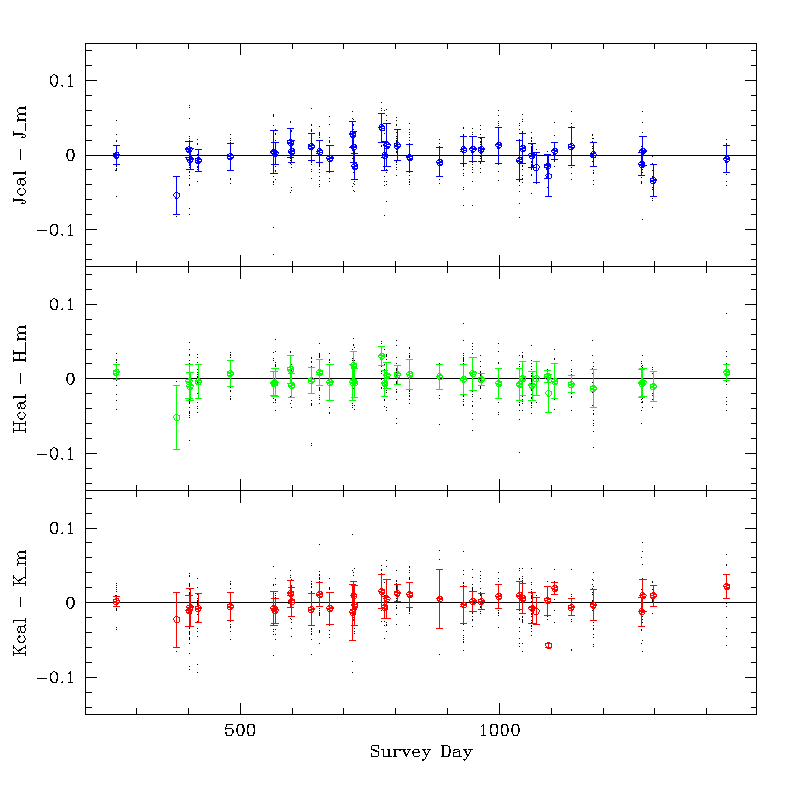 |
| Figure 8 Dmag vs Survey Day No. |
Dependencies on Chi-Squared
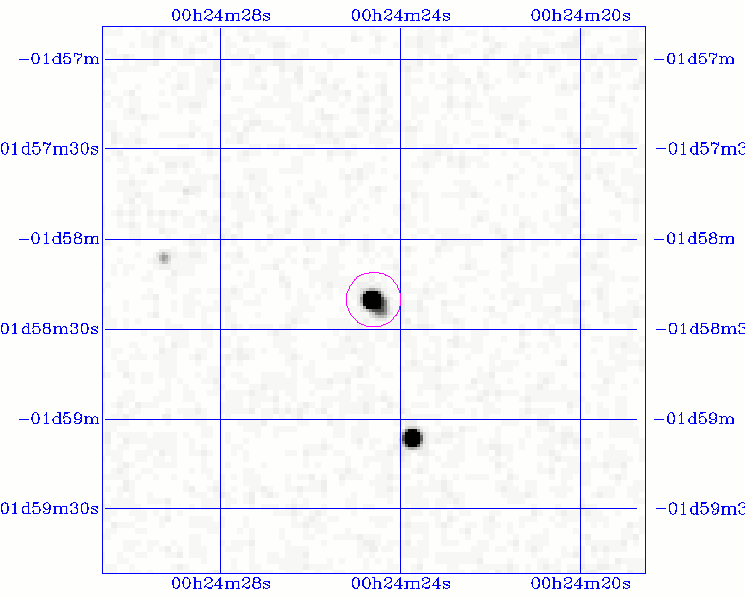
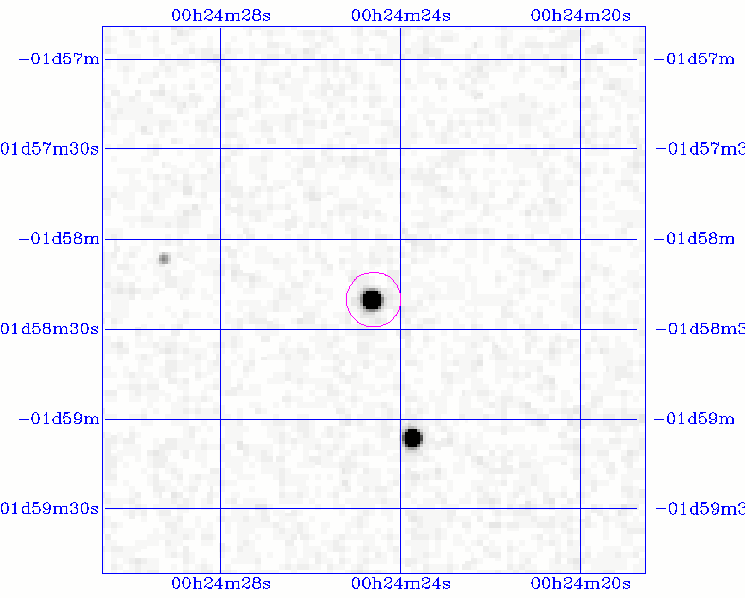
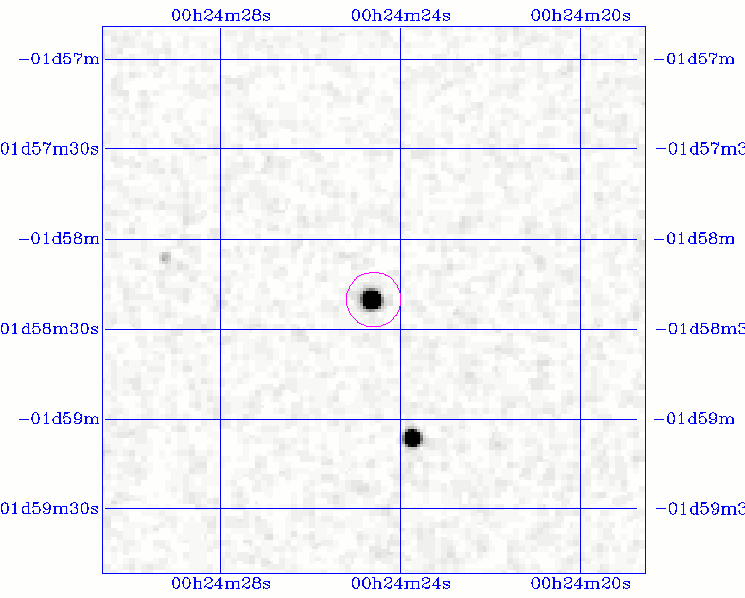
Most of standard star residual plots show that there are a number of individual stars with excessive J and Ks offsets between their "true" and PSC photometry. The largest difference for all of the standards is -0.133 mag in the J-band measurement of BRI0021-0214, the primary standard in the s90021 calibration field. This star is distinguished by having a large value of the psf-fit chi-squared (j_psfchi=7.46), indicating that the source profile was in some way contaminated. Figures 9a, 9b and 9c show 3'x3' 2MASS Survey Quicklook Images centered on the position of BRI0021-0214. The star appears extended in the J-band, but not H or Ks. The J-band "companion" to BRI0021-0214 was detected and measured as a single-band source in pipeline processing, but it failed Catalog selection because of its large chi-squared value (j_psfchi=21.92). The position of BRI0021-0214 was covered twice during survey operations; The photometry from the first coverage, on 15 Sept. 1998 UT, was included in the PSC. Figure 10 shows the J-band image from the second coverage made on 20 October 2000 UT. The star image appears symmetric, the derived J-magnitude is 0.159 mags brighter (Mcal-Mpsc = +0.027 mag), and j_pschi = 0.91. Thus, we conclude that the 980915 UT J-band photometry of this star was contaminated by some transient event such as a cosmic ray strike, or perhaps confusion by a passing uncataloged asteroid.
 |
 |
 |
 |
| Figure 9a BRI0021-0214 J 990915s | Figure 9b BRI0021-0214 H 990915s | Figure 9c BRI0021-0214 Ks 990915s | Figure 10 BRI0021-0214 J 001020s |
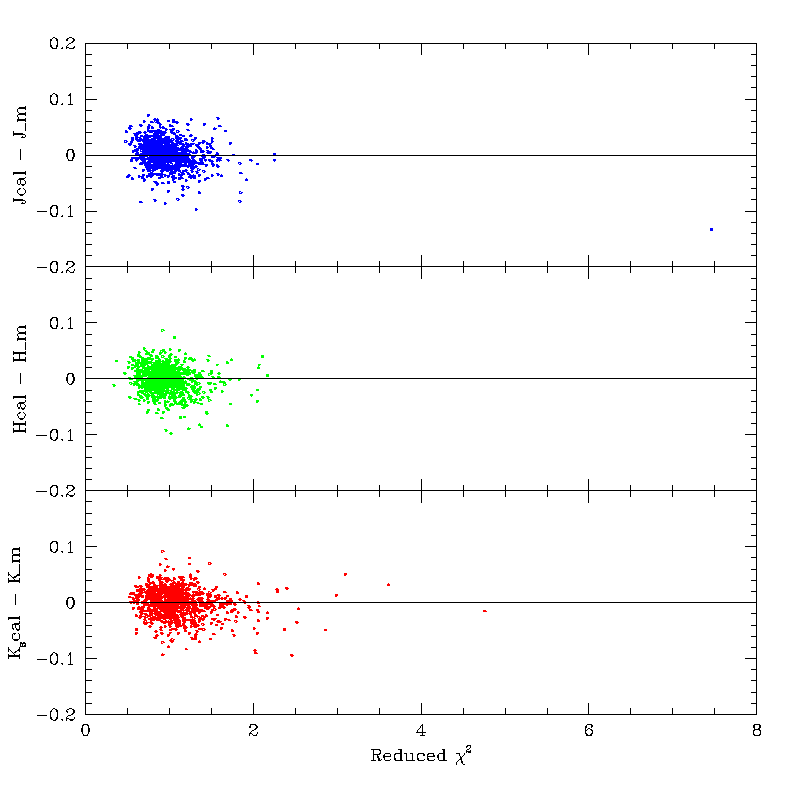
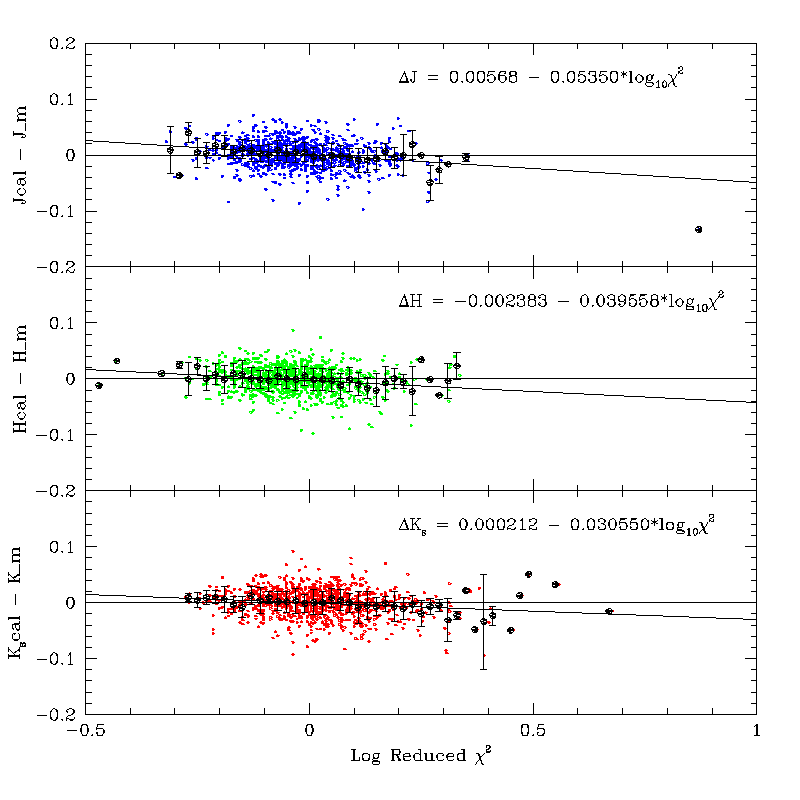
The large chi-squared value of the outlier J-band measurement of BRI0021-0214 prompts examination of the how standard star residuals might depend on photometric chi-squared value. Figure 11 shows the J, H and Ks photometric residuals plotted as a function of profile-fit reduced chi-squared values (?_psfchi). There is the suggestion that the survey magnitudes are systematically fainter than the "true" calibration star magnitudes as the chi-squared value increases. This is much better seen in Figure 12, which shows the magnitude residuals plotted as a function of the log10 of the chi-squared values. The large black points in each panel of Figure 12 are the trimmed average values of Mcal-Mpsc in bins of 0.02 in chi-squared. The error bars on the black points are the RMS of the average values in each bin; the points with very small or no errorbars have <3 samples in the bin.
Also shown in Figure 12 are plots and parameters of the best linear fits to the delta-mag vs. log chi-squared relationships (i.e. power-law dependence of flux ratio on chi-squared). The fits are made using all star points with equal weighting. Since most of the measurements have chi-squared values near unity, the outliers are de-emphasized. Although the variation of photometric residual with chi-squared is small, the measurement appears to be of high confidence. Over the chi-squared range in which most of the stars fall, 0.5-2, the photometric bias amounts to at most ~1%. However, extreme outliers can have substantially larger biases.
 |
 |
| Figure 11 Dmag vs. Chi-Squared | Figure 12 Dmag vs. log Chi-Squared |
The relationship found between photometric bias and profile-fit chi-squared assumes that the "true" standard star magnitudes are drawn from unconfused, unresolved point sources. Since the standards were selected to be this way, and because the "true" magnitudes are derived from hundreds to thousands of measurements, this assumption is reasonable. Interpreting the relationships shown in Figure 12 as a bit trickier, though. There are a number of reasons that the profile-fit chi-squared value will be elevated: confusion from the overlapping psf from a nearby source, a cosmic ray strike within the profile of the source, or like many galaxies, the source profile is broader than the psf. Focal-plane distortion also causes sources closes to the cross-scan edges to deviate from the mean psf derived from the full focal plane.
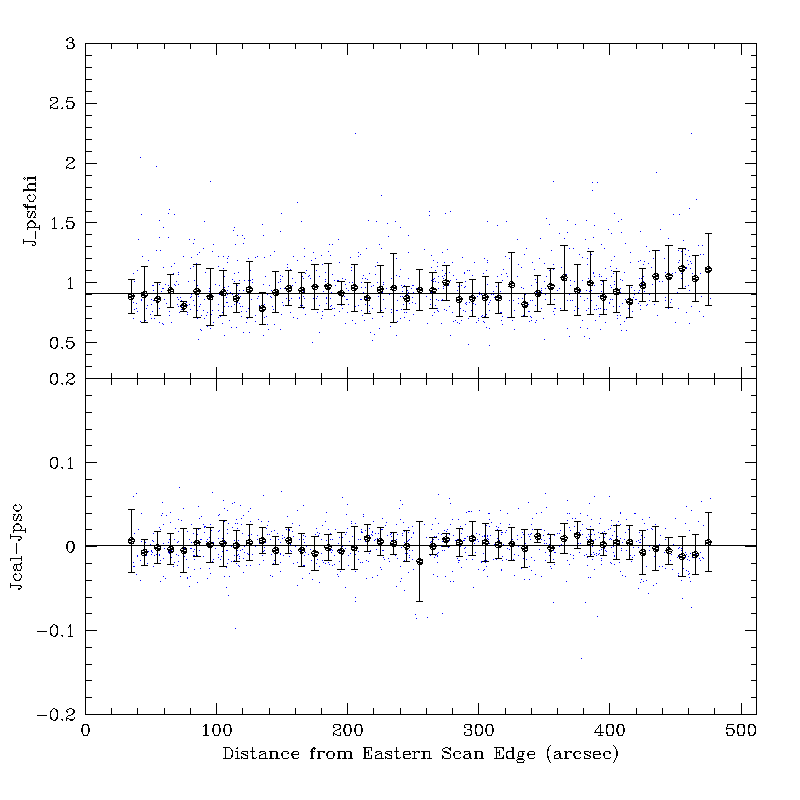
The small photometric bias with chi-squared value shown in Figures 11 and 12 is not associated with focal plane distortion. This is shown in Figures 13a, 13b, and 13c, which contain plots of the J, H and Ks reduced chi-squared values and magnitude residuals as a function of the distance from the eastern scan edges. The small color points represent individual star measurements, and the large black points are the trimmed average and RMS values in 5" wide bins. The scale of the chi-squared ordinate in these figures is truncated, so the point for BRI0021-0214 is not shown. It falls at cross-scan position of ~380".
The standard star "true" magnitudes are derived from the calibration star scans, where the standards are always located in the central cross-scan half. The standards can fall anywhere in the focal plane during the survey scans (and do as seen in Figures 13a-c). There is a small systematic increase in J and Ks chi-squared towards the edges of the focal planes, but no corresponding bias seen in the photometry because the cross-scan focal plane distortion photometric correction (DMAGCOR) applied during pipeline processing effectively removes it. Elevated values of chi-squared are seen at all cross-scan positions, so chi-squared is most likely affected by factors associated with individual measurements, such as short timescale seeing variations, cosmic rays, asteroid confusion, etc.
 |
 |
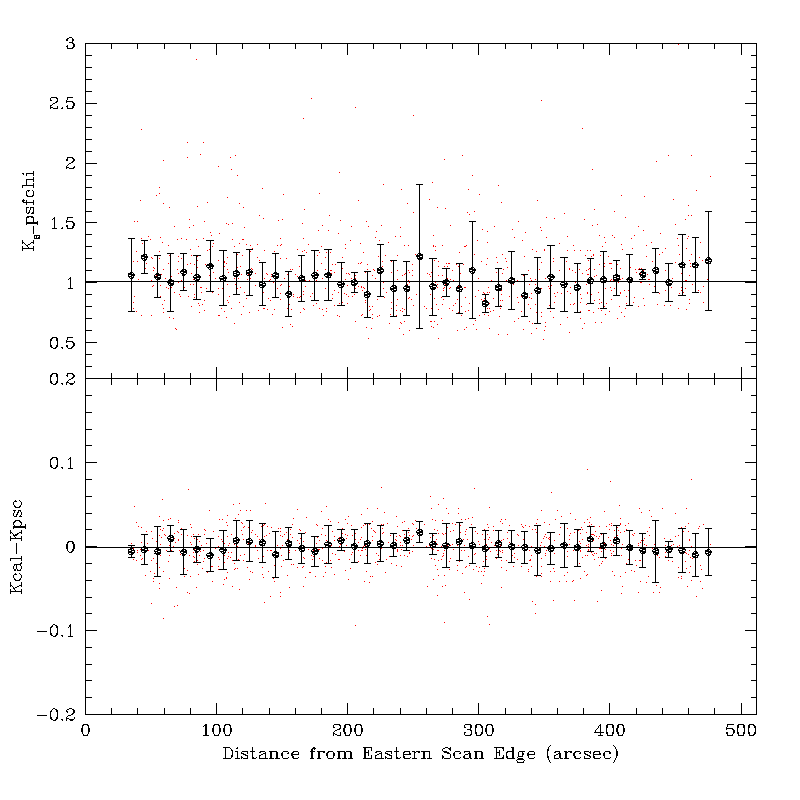 |
| Figure 13a J-chi and DJ vs. Edge Dist | Figure 13b H-chi and DH vs. Edge Dist | Figure 13c K-chi and DK vs. Edge Dist |
[Last Updated: 2002 October 9; by R. Cutri]
Previous page. Next page.
Return to Explanatory Supplement TOC Page.