External Review Board - June 2001
I. Detailed 2MAPPS v3.0 Development, Implementation and Testing Document
II. Major Subsystem Changes
- Instrumental Calibration:
- Construct and use "canonical" dark and flat-field images from averages of large blocks of survey data, appropriate to telescope and hardware changes. Objective is to smooth variations due to nightly statistical fluctuations (darks) and seasonal twilight sky illumination variations (flats)
- Residuals between individual and canonical flats < 1-2%, so modifications minor
- Flat-field cross-scan correction maps derived from point source mapping tests taken throughout the survey applied to canonical flats. Objective is to remove 1-2% wavelength dependent residuals that induce small, but observable color variations
- Status - Green. Production calibration images generated and tested.
Figure 1a - Mean flux residuals as a function of cross-scan position for southern 2MASS camera. 2-d residuals measured by mapping relative brightness of high SNR point sources in a 6x10 grid around the focal plane. These plots show the residuals collapsed in the in-scan direction. Each line represents a measurement taken during a different time of the survey.
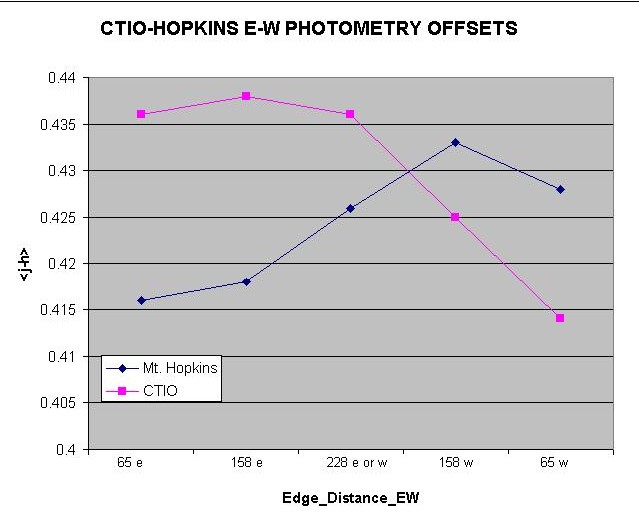
Figure 1b - Observed mean J-H color of high SNR sources as a function of cross-scan position (distance from focal plane edge). The red curve shows sources measured from CTIO and the blue curve sources measured at Mt. Hopkins.
Figure 1c - Predicted color-dependence on cross-scan position from the measured flux residual maps (as in Fig. 1a). Color coding is as in Fig. 1b. Compare the top panel with Fig. 1b.
- Meteor Streak Removal from Atlas Images:
- Meteor streaks identified by linear configuration of spurious single-frame detections. Stack 3 bands to improve signal.
- Streak blanked only in affected JHKsframes. Coaddition to produce normal Atlas Image with trail removed.
- Objective is to minimize spurious detections of trails. Meteor trail "sources" are major source of unreliability in extended source detection at high galactic latitude.
- Detection/blanking reliability >90%, Completeness ~75%. Some faint trails persist becuase they do not trigger enough "detections."
- Status - Green. Code implemented and tested.
Figure 2a - Atlas Image pair showing a meteor trail with detections marked with green crosses on the left, and the same image on the right when the meteror trail is blanked in a single frame in all three bands prior to coaddition.
- Astrometry:
- Frame distortion maps measured for all arrays and throughout survey by comparison with high density external astrometric catalog. Corrections for distortion now applied to positions of extracted sources.
- Astrometric solutions improved by using higher density Tycho-2 reference catalog. Not available during preliminary processing.
- Astrometric solutions improved in lower reference-star-density regions by propagating solutions across scans using information from multiply observed sources in scan overlap regions.
- Demonstrated RMS residuals with respect to UCAC astrometric catalog of ~120 mas on each axis, with reduced incidence of outliers (UCAC has estimated accuracy of ~20 mas).
- Status - Yellow. Distortion maps measured and implemented. Tycho 2 implemented. Code modifications implemented and tested. Preprocessing for cross-scan solution propagation is ~80% finished, and will be complete by July 1. No schedule risk because can start operational processing with nights for which preproduction data are ready.
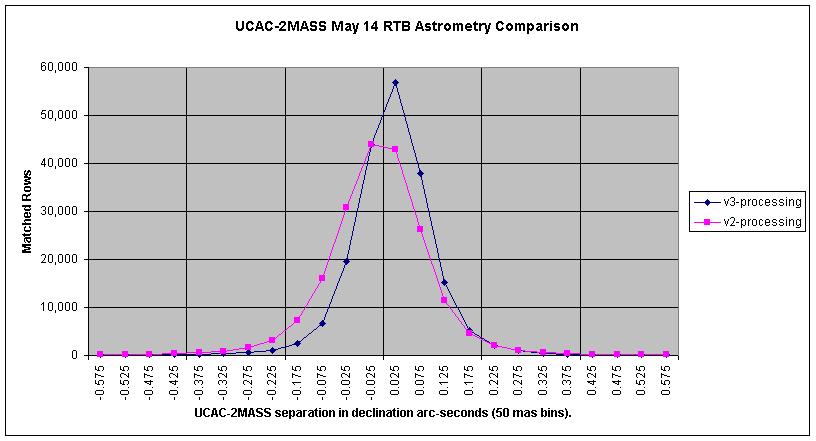
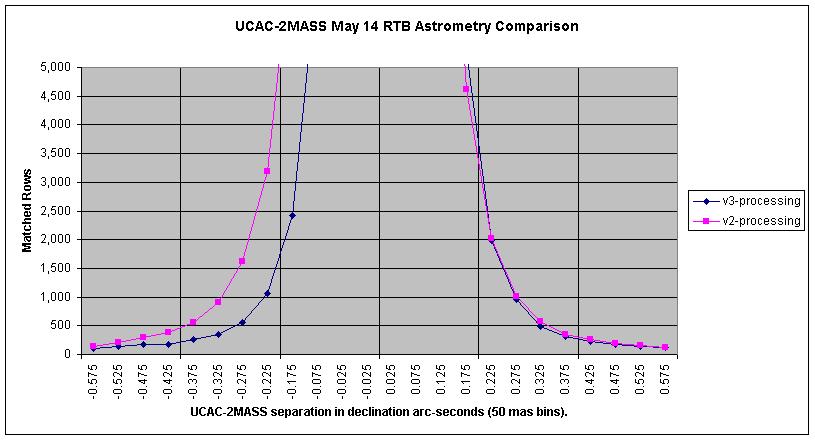
Figure 3a - Distribution of DEC offsets (in arcsec) between 2MASS and UCAC positions for 2MASS sources with SNR>30 in all bands. Red curve shows offsets from preliminary 2MASS processing (v2) and the blue curve shows the results of 2MAPPS v3 test processing.
Figure 3b - Detail of DEC offset curves shown in Figure 3a to show the wings of the distributions. The number of outliers are greatly reduced and the distribution is more symmetric with v3.0 processing.
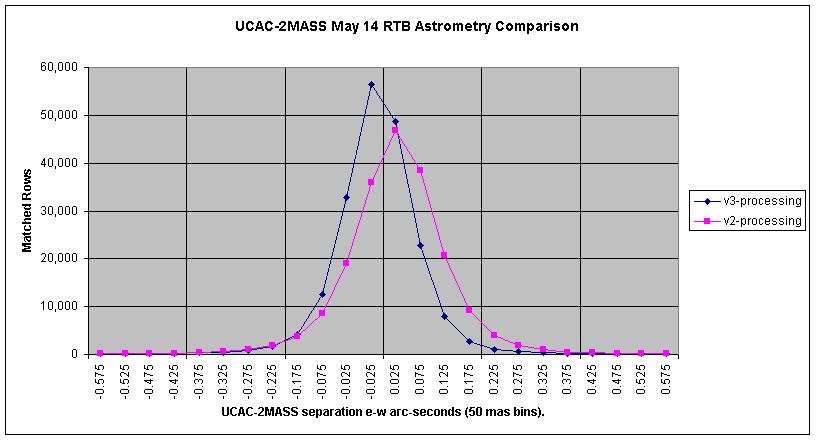
Figure 3c - Distribution of RA offsets (in arcsec) between 2MASS and UCAC positions for 2MASS sources with SNR>30 in all bands. Red curve shows offsets from preliminary 2MASS processing (v2) and the blue curve shows the results of 2MAPPS v3 test processing.
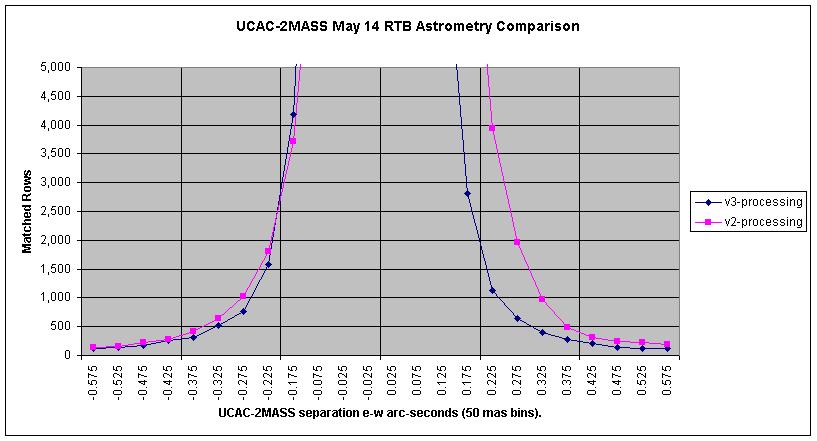
Figure 3d - Detail of RA offset curves shown in Figure 3C to show the wings of the distributions. The number of outliers are greatly reduced and the distribution is more symmetric with v3.0 processing.
- Very Bright Star Photometry and Positions:
- Stars saturated in R1 exposures are measured by fitting template to non-saturated part of 1-d radial profile. Template derived empirically by measuring profiles of large numbers of bright stars of known magnitude.
- Although no requirement for saturated star photometric accuracy, goal is ~0.3 mags. Achieving ~0.2 mag RMS. Good brightness and position estimates necessary for proper artifact identification which is key driver to meeting general reliability requirements for survey.
- Single reliable detection of very bright stars with positions accurate to <0.3" RMS.
- Bridges gap with TMSS.
- Status - Green. Templates produced. Code implemented and tested.
Figure 4a - Residuals between template fits and published photometry from saturated R1 stars measured at CTIO. Figure 4b - Residuals between template fits and published photometry from saturated R1 stars measured at Mt. Hopkins. Figure 4c - JHKs color-color diagram for stars in 12 RTB nights with R1 saturation in one or more bands. The green and red lines denote the main sequence and giant tracks from Bessel and Brett. The color-coding indicates which bands are R1-saturared. - Improved Point Response Functions (PSFs) for Profile-fit Photometry
- New production PSFs generated using data spanning entire survey, reflecting all significant hardware changes and seeing conditions.
- Objective was to remove magnitude-biased chi-squared statistics obtained for profile-fit photometry in preliminary processing. Higher SNR sources have systemmatically low chi-squares.
- Efforts to smooth chi-squared statistics increases magnitude-dependent brightness bias between profile-fit and aperture photometry.
- Conclusion that PSF-modeling is reaching limit what can be reasonably expected of raw data that is 10x undersampled, given resources and schedule of survey.
- Status - Yellow. Science Team has concluded that quality of photometry should take precedence over statistics of photometry. Decision has been made to revert to original PSF-generation algorithm. Production PSFs are being generated now and will be ready to support operational test period after validation. Will include extensive characterization of photometric statistics in final Explanatory Supplement.
Figure 5a - Profile-fitting chi-squared statistics plotted versus magnitude for sources observed on 9803019s, from preliminary 2MASS processing. Black points are individual stars and large red points are the trimmed average chi-squared for all stars in 0.2 mag bins.
Figure 5b - As in Figure 5a, but from 2MAPPS v3.0 test processing.
Figure 5c - Difference between profile-fit and aperture photometry plotted versus magnitude for sources observed on 9803019s, from preliminary 2MASS processing. Black points are individual stars and large red points are the trimmed average magnitude differences for all stars in 0.2 mag bins.
Figure 5d - As in Figure 5c, but from 2MAPPS v3.0 test processing.
- Point Source Deblending:
- Allow multiple PSF-components to be fit to single detections if chi-squared statistic above specified threshold. Objective is to provide better brightness estimates in complex regions.
- Adopt conservative approach that strives for highly reliable deblends (e.g.Relatively high chi-sqaured threshold, and strict deblend acceptance criteria). This minimizes impact on runtime.
- Simulations show accurate deblending of ~80% of SNR>40 doubles with 2-3" separation with magnitude differences of 1 mag. Deblending reliability decreases with larger magnitude differences and smaller separations.
- Status - Green. Deblending code implemented and thresholds defined. Need to characterize deblended population on large set of data in operational testing.
Figure 6a - Fraction of double sources deblended as a function of magnitude in 2.8" separation delta-magnitude = 1.0 simulation.
Figure 6b - Chi-squared distributions before and after deblending in simulated data.
Figure 6c - Distributions of deblended component separations in 2.8" (top) and 2.0" (bottom) simulations.
Figure 6c - Comparison of expected and measured brightnesses as a function of blend brightness for 2.8" separation simulated data.
- Point Source Photometric Normalizations:
- Aperture curve-of-growth and R1/R2-R1 normalizations derived as a function of seeing (FWHM) using all survey data.
- Objectives are to use normalization factors with much better statistical accuracy than empirical values determined for each scan, to improve runtime since empirical normalizations no longer determined, and to fix bug in which empirical normalization measurements were sometimes contaminated by very bright star in scan.
- Uncertainty in corrections for given FWHM < 0.004 mags.
- Status - Green. Global normalization values as function of seeing derived. Code modifications implemented and tested. Parameters will be validated made when final production PSFs are implemented.
Figure 7a - Aperture Curve-of-Growth corrections as a function of seeing shape (proportional to FWHM) for different periods of northern operations. J-band is represented in blue, H-band in green and Ks-band in red.
Figure 7b - R1/R2-R1 normalization corrections as a function of seeing shape for southern data. These are corrections to the nominal exposure time differences (3.49 mags).
- Extended Source Photometry and Characterization:
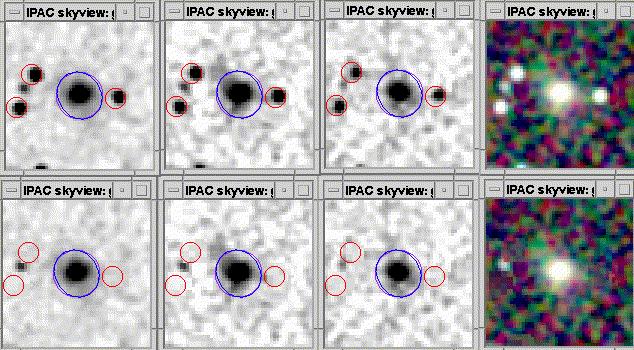
- Improved foreground star subtraction to provide better photometry of extended sources in the Galactic Plane and to minimize subtraction of pieces of galaxy in edge-on systems. Foreground sources subtracted rather than masked. Star-subtracted images will be saved along with regular Extended Source Postage Stamps.
- Kron photometry improved by extending first-moment integration out to 4 scale lengths, to match better the radial light profile of the galaxies. Objective is to reduce the 20% underestimate of total brightness measured for preliminary processing and Total source photometry utilizing feedback from published studies of galaxy photometry of 2dF survey. Objective is to remove measured bias between Kron and Total brightness estimates (total magnitude is measured by integrating extrapolated elliptical radial profile out to 20 mag/arcsec2 isophote). .
- Improve Oblique Decision Tree (OBDT) classification of extended sources with greatly expanded training set, and insert OBDT classification sources in pipeline. Objective is to improve runtime and efficiency (filter out obvious false extended sources) and to reduce final product generation task load.
- Status - Green. All code implemented and tested. Further validation to be done with large data sets from operational testing.
Figure 8a - Example of foreground star substraction for extended source processing in high source density regions. Top panels show J, H, Ks and 3-color composite of original Atlas Image containing Ks=12.5 galaxy. Bottom panel shows field after foreground stars are subtracted.
Figure 8b - Difference between Kron and Total magnitudes plotted versus Kron magnitude as measured using 2MAPPS v3.0 tests for galaxies in the Abell 3558 field. White points represent galaxies with no foreground star contamination, and green crosses are galaxies with foreground stars subtracted.
- Artifact and Confusion Flagging:
- Refine artifact flagging parameters using data accumulated for entire survey.
- Improved artifact flagging in response to variable background source density.
- Sources within "confusion" radius of brighter stars now flagged as having biased photometry biases. Radius is defined as separation where flux bias is >5%. Simulations used to measure confusion radius as a function of magnitude difference between parent and biased source.
- Status - Green. Artifact search parameters derived. Simulations complete. Code modifications implemented and tested. Final adjustment of parameters will be made using large set of data from operations testing.
- Photometric Calibration:
- Derive improved photometry of calibration stars using global analysis of all calibration data collected during survey. Derives photometry of calibration stars with highest degree of internal consistency. Change in standard star magnitudes from global analysis using ~half of survey data typically << 1%.
- Global calibration analysis also provides monthly average atmospheric extinction coefficients
- Higher frequency fits to nightly zero points made, reflecting atmospheric behavior observing over course of survey. J-band transmission changes most rapidly, so fit on hourly basis. H and Ks much more stable, so use only a linear fit with time over the night.
- Status - Green. Global calibration analysis complete. Final standard star magnitudes and extinction coefficients derived. Code modifications implemented and tested.
Figure 10a - Difference between previous and new globally-calibrated standard star magnitudes for 2MASS calibration. J-band is on the top, H-band center, and Ks-band bottom. Vertical scales are +0.05 mags. Horizontal scales are RA of standards.
Figure 10b - Monthly atmospheric extinction coefficients (mag/airmass) for northern 2MASS site determined from global calibration processing. J-band is blue, H-band is green, and Ks-band is red. Solid lines show the survey-monthly-average extinction values.
Figure 10c - Same as for Fig. 10b, but for the southern 2MASS site.
Figure 10d - Distribution of differences between "true" standard star magnitudes and magnitudes determined by calibration each against all other standards observed on all survey nights. Different colors represent residuals calculated using different zero point fits for each night. Black curves show residuals to the constant zero point fits, red shaded curve shows the linear fit residuals, green shaded curve shows the quadratic fit residuals, and the blue curve shows the piecewise fit residuals. The smallest spread in residuals is found for piecewise fits in J, and linear in H and Ks.
Figure 9a - Relative extracted source density around all northern 7.0 < J < 7.25 stars. Plot is made by extracting sources within 100" of all bright stars, shifting to coordinate grid centered on the bright stars, and plotting all sources on a common grid. The overdensity of sources are caused by spurious extractions on diffraction spikes, dichroic glints, latent images, etc.
Figure 9b - Measured brightness of artifical
stars placed around brighter stars plotted as a function of separation
from brighter star. Three cases corresponding to a 5 mag difference
between "parent" and "child" stars. Close to the parent, the
brightness of the child is systemmatically overestimated.
Last Updated: 1 June 2001
R. Cutri - IPAC