Initial investigation of H-only sources
A database selected to contain H-band only sources (rd_flg = 010 or 020 or 030) from the v3_pscat contains 4.5 million objects.
| All | 4.5M | |
| prox > 8. | 1.5M | |
| ph_qual like '_A_' (all UAU) | 757K | |
| ph_qual like '_A_' and prox > 8. | 168K | 584 are 010's |
| abs(glat)>20. | 267K | |
| abs(glat)>20. and ph_qual like '_A_' | 58K | |
| abs(glat)>20. and ph_qual like '_A_' and prox>8. | 48K | 53 are 010's |
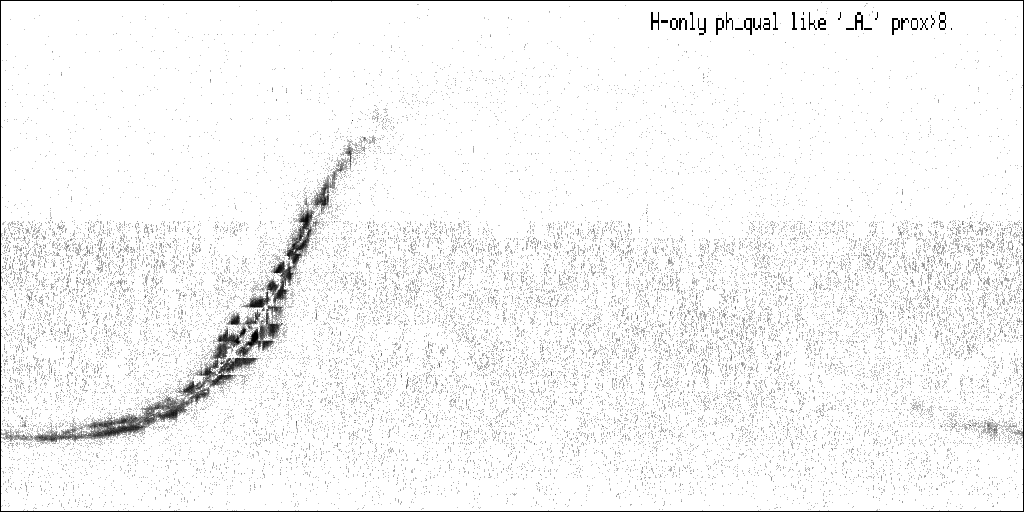
Most telling is the all-sky distribution of these sources. The plot below shows all prox>8. sources with ph_qual like 'UAU'. The plot is a cartesian projection from +90 to -90 dec and RA begins at 0 in the center of the plot and increases to the right. There is clearly an excess in the South. In addition, the confusion effects near the plane have a strange declination dependence within each declination band.
