create table sloan_subset_55 as select cntr,scan_key,ra,decl,j_m,h_m,k_m,rd_flg,cc_flg,ext_key,ph_qual from v3_pscat where (ra between 0. and 55. or ra between 352. and 360.) and decl between -1.0 and 1.0and then created a table of source in 2MASS which did not have an SDSS counterpart:
create table sloan_nomatch_pscat_55 as SELECT * FROM sloan_subset_55 as a WHERE NOT EXISTS (select b.* FROM sloan_primary AS b WHERE distance(b.ra,b.decl,a.ra,a.decl) < 1.5 AND b.decl between a.decl - 0.0014 and a.decl + 0.0014 AND b.ra between a.ra - 0.002 and a.ra +.002
| 2MASS sources | Non-matching sources | |
| All | 208766 | 4371 |
| Contains "A" | 140804 | 1158 |
| "A",rd="222", cc="000" | 132719 | 586 |
| "AAA", cc="000" | 86403 | 349 |
The first thing I looked at was the spatial distribution of various selections from the database.
All sources

rd_flg='222' sources

rd_flg!='222' sources

Why does the hemispheric overlap show up in the non-222 sources. This would suggest many are artifacts (and thus there were two chances to make them at the dec boundaries).
The complete list of non-matching sources is here.
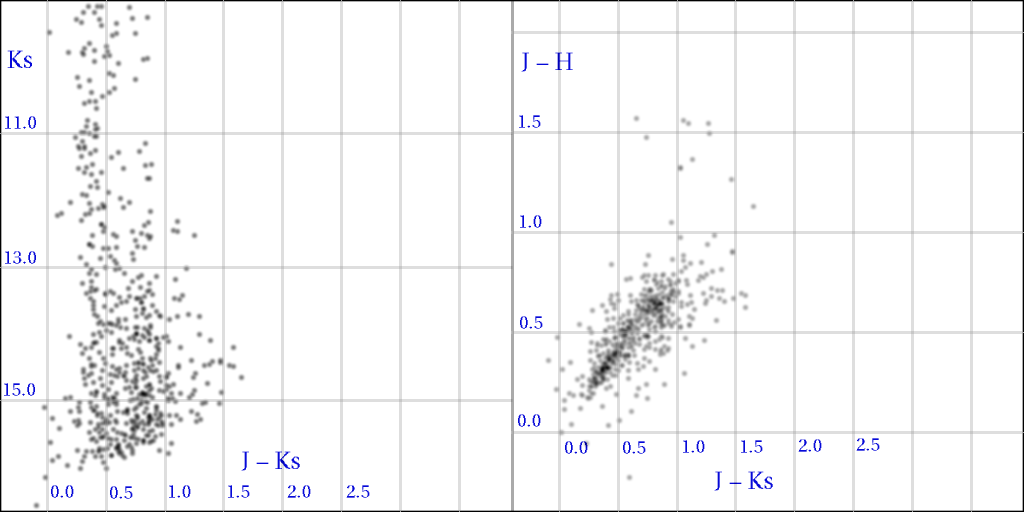
A color-color plot of the non-matching AAA sources show that they are mostly stars and suggests they were missed by SDSS. Although there are a handfull of objects with extremely red J-H colors that do not look real.
