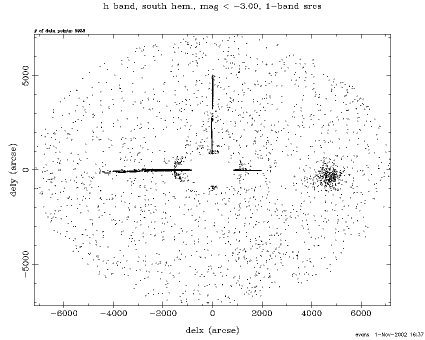
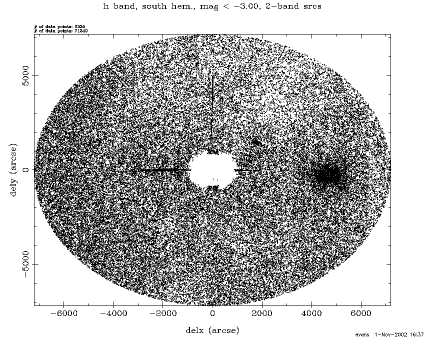
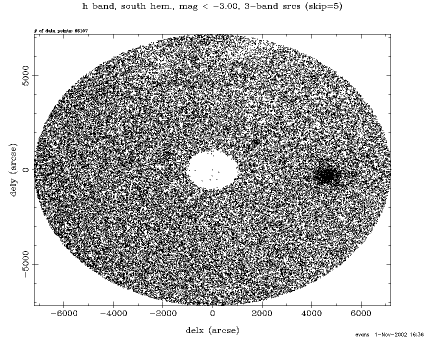
The following three plots are of all single, double, and triple band sources in the vicinity of the bright star:

| 
| 
|
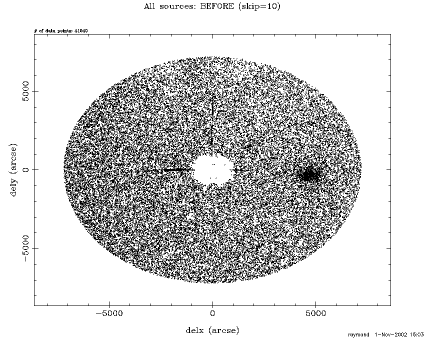
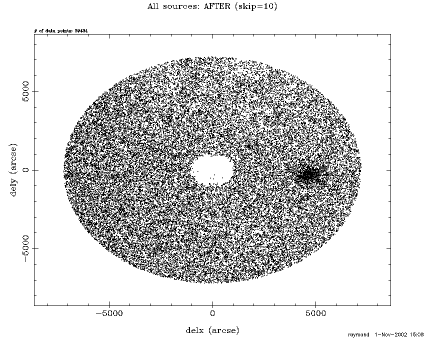
The following two figures plot all sources before suspect ph_qual flags are removed and after suspect ph_qual flags are removed:
| 
|
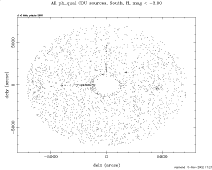
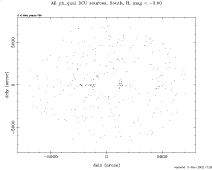
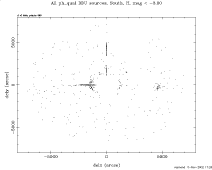
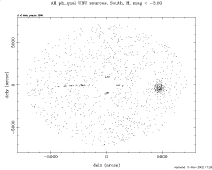
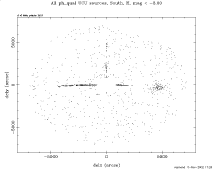
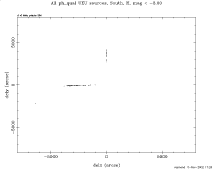
The following figures are ph_qual sources that have obvious residual
diffraction spike sources:
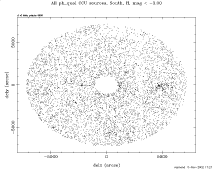
| 
| 
| 
|
| 
| 
| 
|

| 
| 
| |
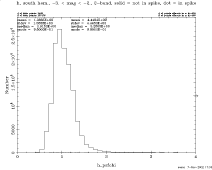
The figures below contain the [JHK] PSF chi2
histograms for the single- and double-band sources, where the solid
lines indicate the populations that are outside the approximate
residual spike areas and the dotted lines indicate the populations
that are inside those areas. Not every source in theseoinside
populations is actually found in a spike, but most are. The text
directly above the histograms indicate the means, standard deviations,
medians, and modes for these histograms, with the "outside" population's
values on the left and "inside" population's values on the right.
| mag bin: -3.00 to -2.00 | 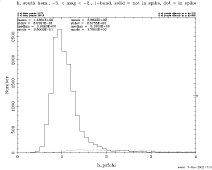
| 
|
| 1-band sources | 2-band sources | |
| mag bin < -3.00 | 
| 
|
| 1-band sources | 2-band sources |