XCIX. Global color variation in the Point Source Catalog
1. Introduction and goals
We need to understand the spatial variations intrinsic to the data acquisition to be able to use the Point Source Catalog to infer structure. This section investigates the color changes in a narrow J-H range chosen empirically from the 2MASS color-color to plot be blueward of the giant branch. This population, therefore, emphasizes the extended solar neighborhood. The center of this color range corresponds to an early G-dwarf (Bessell&Brett 1988). These queries are typical of those for stellar populations studies.
a. Details
- One query for equal area great circle--latitude bins. The RA/DEC or L/B intervals are chosen evenly and the co-latitude bins are chosen evenly in cos(latitude). The bins are equal area and rectangular in Cartesian coordinates. I used 180 bins in longitude and 90 bins in cos(latitude)
- The query (translated to the current column semantics) is:
select ... WHERE cc_flg='000' AND bl_flg='111' AND ph_qual='AAA' AND rd_flg='222' AND (j_m-h_m) BETWEEN 0.30 and 0.34 AND use_src=1 - The following cuts are applied in turn to each spatial sample:
- Ks<13.5
- Prox > 8 arcsec
b. Statistics
I tabulated the following statistics for each group:
- Number
- Mean
- StdDev
- Quartiles
2. Results and discussion
a. Number counts
 |
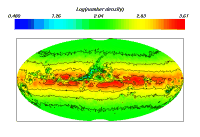 |
| Figure 1 | Figure 2 |
These first two figures show the binned counts with additional restrictions. Although I intended this section for reference only, Figures 1 and 2 demonstrate the effect of low and moderate latitude reddening and extinction on number counts shown in Cartesian and Aitoff projections, respectively.
| Cartesian | Aitoff |
 |
 |
| Figure 3 | Figure 4 |
Figures 3 and 4 show a plot of the J-H extinction derived using the Schlegel, Finkbeiner, & Davis (1998, ApJ, 500, 525) maps to derive the reddening along a sight line. The relations from Bessell & Brett (1988) are used to convert from E(B-V) to monochromatic extinctions. Note that the strong gaps in number counts in Figure 1 (Figure 2) coincides with the plume of J-H extinction near zero longitude and colatitude between zero and twenty five degrees in Figure 3 (Figure 4).
 |
 |
 |
 |
| Figure 5: no cut | Figure 6: Ks<13.5 | Figure 7: Prox > 8 | Figure 8: both cuts |
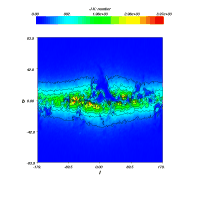
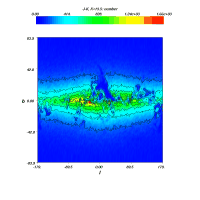
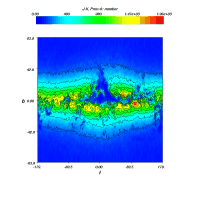
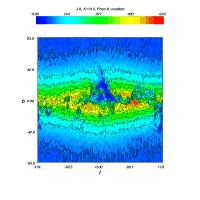
Figures 5 through 8 show the same number counts now broken up in to subgroups based on the cuts: Ks<13.5 and Prox > 8 arc seconds. The most reliable section for stellar populations uses both cuts to mitigate confusion noise and sensitivity variations for lower signal-to-noise photometry (Fig. 8). These cuts, of course, lower the contrast of the high density Galactic plane.
Finally, note that the narrow G-dwarf color cut amplifies the effect of extinction by design. For example, the low source count swath north of the Galactic center can be recovered by widening the J-K window to include the 0.3 magnitudes of extinction (see Fig. 3).
b. Mean J-K color
| Cartesian | Aitoff | Cartesian/Equatorial |
 |
 |
 |
| Figure 9 | Figure 10 | Figure 11 |
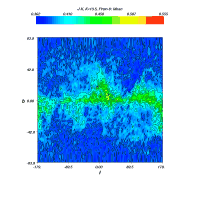
Figures 9 and 10 show the fiducial mean J-K color plots for both the flux and proximity cuts. In galactic coordinates, one sees a quadrant blue color feature, roughly 0.04 mag, near the north celestial pole (Figure 10). There is no significant evidence that this is a systematic in the survey rather than a coincidence of a low-to-average extinction region at low galactic latitude adjacent to a high extinction region.
| Galactic | Equatorial |
 |
 |
| Figure 12 | Figure 13 |
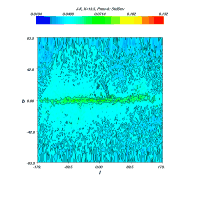
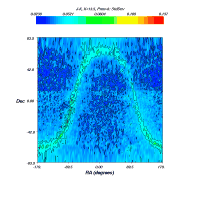
For reference, Figures 12 and 13 show the root sample variance in J-K. Besides the Galactic plane and features correlated with extinction and reddening (see Figs. 1 and 2), one sees declination band and North/South observatory correlation in the root variance of J-K at the 0.01-0.02 magnitude level (Figure 13).
| Galactic | Equatorial | ||
| Cartesian | Aitoff | Cartesian | Aitoff |
 |
 |
 |
 |
| Figure 14 | Figure 15 | Figure 16 | Figure 17 |
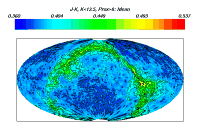
As a summary, these plots (Fig. 14-17) compare the mean J-K in both coordinate systems and projections. For high galactic latitude, |b|>30ˆ, the variance in mean J-K is less that 0.015 mag.
c. Other color catagories
| H-K | (J-H)-(H-K) |
 |
 |
| Figure 18 | Figure 19 |
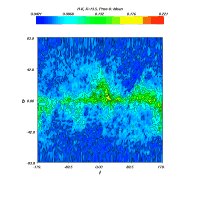
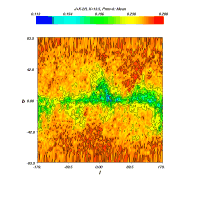
As described in Section 1, the reddening vector is nearly in the direction of J-K in the J-H vs. H-K two-color diagram. The direction perpendicular to the reddening vector is therefore (J-H)-(H-K)=J+K-2H. This overall variation in clearly largest in J-K, followed by H-K and smallest at J+K-2H. In addition, this color could in principle reveal systematic non-reddeding color changes in the survey. Excluding the variations near the Galactic plane, the variation in this color is approximately 0.01 mag (and this is dominated by the contributions at small |l|) and suggests no new systematic color bias.
3. Confusion and blend flags
An additional query without the restrictions
cc_flg='000' and bl_flg='111' results in
qualitatively equivalent results for mean color. The overall number
counts increase by nearly 50% without a flux or proximity cut. With
either cut applied the total number is roughly 10% larger than with
cc_flg='000' and bl_flg='111'. This is not
surprising: at low latitude, proximitous sources will be fainter on
average.
4. Conclusions
- One can detect an approximately 0.01 color variance between declination bands observed by the Northern and Southern observatories and between moderate and high declination bands in the North.
- The survey does not have an obvious systematic color drift in right ascension that is inconsistent with Galactic extinction.
- It should not be a surprise that accurate modeling of global Milky Way stellar structure will require detailed attention to the extinction and reddening model. For example, number counts in stars restricted to G-dwarf colors are low in known regions of high interstellar extinction are reduced by an order of magnitude; these regions cover significant area extended to north and south latitudes of 35 degrees at some longitudes (e.g. Galactic center and the Orion spurs).
- Confusion noise and stellar image blending does not demonstrate a clear color dependence. However, these photometric artifacts dominate the low Galactic latitude sky.
[Last Updated: 2003 Jan 17; by Martin D. Weinberg]