Introduction
Bright stars in the 2MASS survey throw off confusion halos and diffraction spikes that generate false detections. These false detections are systematically removed by looking in areas where they are most likely to appear. Confusion halo artifacts typically appear within a magnitude-dependent radius of the parent star. Diffraction spike artifacts typically appear all along the diffraction spike, but are mostly concentrated near the center and thins out as you move away from the center. Diffraction spikes also have a tendency to spread out as you move increasingly farther away from the center. Processing software written for this artifact removal task essentially blanked specific areas around bright stars (depending on their magnitudes).
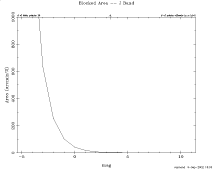
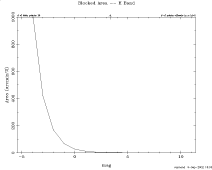
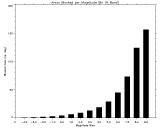
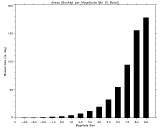
The survey area blanked by the presence of bright stars totaled 106.16 deg2 in J band; 156.21 deg2 in H band; and 177.87 deg2 in K band.
[Caveat]: This is an updated analysis. Initially, it was updated to reflect the changes made to the all-sky release catalog after the addition of Read-1 sources and deletion of hot H-band pixel sources. Subsequently, it was updated to remove fainter stars because they dominated the star counts but contributed very little to the overall masked area.
[Caveat]: Please note that the calculation of the bright star masks in this analysis are not adjusted for density (diffraction spikes become shorter in high density regions, hence requiring smaller diffraction spike masks) and should be viewed as upper limits.
Analysis
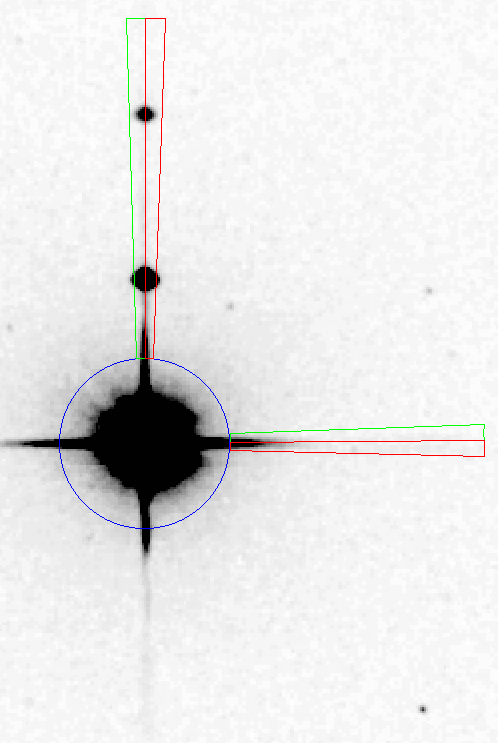
The calculations were performed in stages. First, the artifact confusion area around the star was computed (blue circle below). Next, the blocked area around each spike was computed. Since each of the four spikes has unique parameters, the blocked area for the spikes was computed individually and then summed together. The calculation of the blocked area around a spike started with dividing the block in half along its length (see red pologon below). The area of this polygon was computed by integrating small pieces of rectangles starting from the edge of the confusion radius to the maximum length of the spike block. The result was then doubled (see green polygon) to arrive at the final area for the spike block. The process was then repeated with the next diffraction spike. When all the areas of the spike blocks were calculated, they were summed and that result was added to the artifact confusion area to get the total area blocked out by the bright star.
This analysis was performed using a list of all duplicate-resolved sources brighter than 9th mag in each band selected from the all-sky release catalog. Additionally, the selection was constrained to only sources with ph_qual = A, B, C, D, E, or F and rd_flg != '0' in the selected band. The number of sources in J band totaled 1,110,586; H band totaled 2,415,142; K band totaled 3,370,693.
Results
The plots below will give an idea of the amount of area blanked as a function of magnitude:

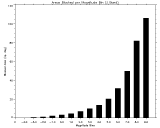
The summed area blanked by all stars in a given magnitude bin:
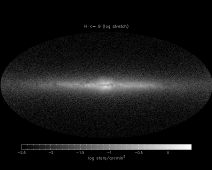
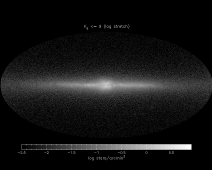
The source density distribution of the stars on an Aitoff projection in each band:

The number of sources and area covered in J band:

          mag total area cumulative area
#  srcs   bin    (deg^2)         (deg^2)
======= ===== ========== ===============
      0 -4.00     0.0000          0.0000
      3 -3.00     0.7470          0.7470
      6 -2.00     0.5688          1.3158
     23 -1.00     0.8248          2.1406
     71  0.00     1.0852          3.2258
    251  1.00     1.4318          4.6576
    957  2.00     2.4113          7.0689
   2455  3.00     2.7879          9.8568
   6619  4.00     3.7072         13.5640
  23815  5.00     6.8516         20.4156
  63977  6.00    11.0280         31.4436
 167180  7.00    18.3624         49.8060
 429334  8.00    32.0620         81.8680
 415895  9.00    24.2968        106.1648

The number of sources and area covered in H band:

          mag total area cumulative area
#  srcs   bin    (deg^2)         (deg^2)
======= ===== ========== ===============
      3 -4.00     0.5842          0.5842
      6 -3.00     0.5841          1.1683
     21 -2.00     0.6844          1.8527
     60 -1.00     0.9616          2.8143
    210  0.00     1.4213          4.2356
    740  1.00     2.1558          6.3914
   2213  2.00     2.8704          9.2618
   6323  3.00     3.9770         13.2388
  16353  4.00     5.4842         18.7230
  53737  5.00    10.1923         28.9153
 136587  6.00    16.1870         45.1023
 356468  7.00    28.0327         73.1350
 931922  8.00    51.0834        124.2184
 910499  9.00    31.9907        156.2091

The number of sources and area covered in K band:

          mag total area cumulative area
#  srcs   bin    (deg^2)         (deg^2)
======= ===== ========== ===============
      4 -4.00     0.4694          0.4694
      6 -3.00     0.2765          0.7459
     32 -2.00     0.5250          1.2709
     93 -1.00     0.6919          1.9628
    296  0.00     1.0472          3.0100
   1019  1.00     1.8132          4.8232
   3352  2.00     3.0843          7.9075
   8130  3.00     4.0778         11.9853
  27030  4.00     7.6282         19.6135
  74294  5.00    13.0373         32.6508
 194354  6.00    22.0641         54.7149
 510678  7.00    39.3000         94.0149
1323471  8.00    61.1044        155.1193
1227934  9.00    22.7549        177.8742
Last Updated: 21 Feb 2003
R. Tam - IPAC
J. Carpenter - Caltech