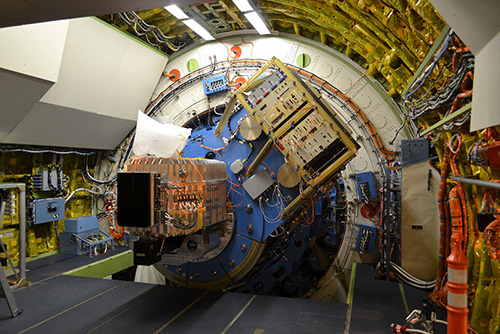
Far Infrared Field-Imaging Line Spectrometer (FIFI-LS)
Facility-class Science Instrument
Principal Investigator:
Alfred Krabbe
Deutsches SOFIA Institut (DSI)
Universität Stuttgart - Institut für Raumfahrtsysteme, Stuttgart, Germany
Instrument Team Website
FIFI-LS was an integral field, far-infrared spectrometer. The instrument included two independent grating spectrometers sharing a common field of view (FOV). The short wavelength spectrometer (blue channel) operated in the 51 – 120 μm wavelength region, and the long wavelength spectrometer (red channel) covered 115 – 200 μm. Each channel had a 5x5 pixel projection onto the sky, with the centers offset by 10”. The blue channel had a pixel size of 6”x6” yielding a 0.5 arcmin-square FOV, and the red channel had a pixel size of 12”x12” yielding a 1.0 arcmin-square FOV. Each spectrometer had a 25x16 pixel detector of Germanium Gallium-doped photoconductors. The 5x5 pixels FOV were re-organized along a 25x1 line, and then dispersed by the spectrometers on 16 pixels in the spectral dimension. The spectral resolution ranged from 600 to 2,000 dependent on the observed wavelength, with higher values towards the long wavelength ends of each spectrometer.
Primary References
"FIFI-LS: The Field-Imaging Far-Infrared Line Spectrometer on SOFIA"
Fischer, et al., 2018, JAI, 7, 1840003-556.
DOI:
10.1142/S2251171718400032
; ADS Bibliographic Code:
2018JAI.....740003F
"Spectral and Spatial Characterization and Calibration of FIFI-LS — The Field Imaging Spectrometer on SOFIA"
Colditz S. et al., 2018, JAI, Volume 7, 1840004-(12)556.
DOI:
10.1142/S2251171718400044
; ADS Bibliographic Code:
2018JAI.....740004C
Handbook for Archive Users
Tutorials
Basic Cube Analysis using SOSPEX
Basic spectroscopic cube analysis using the SOFIA python tool SPectrum Explorer (SOSPEX), which displays FIFI-LS and GREAT spectral cubes and allows the user to perform a number of basic analysis routines on them. The cube is shown as a 2D image (spatial image obtained as average along the wavelength dimension) and as a spectrum (sum of spatial pixels of the original cube).