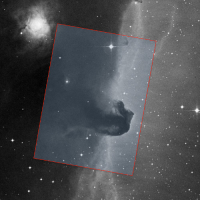
Figure 1. Mapped region overlaid on a POSS-red Sky Survey image.
To demonstrate the unique and important scientific capabilities of SOFIA, and to provide a publicly available high-value SOFIA data set, the SMO Director, Dr. Erick Young, initiated an observing program for obtaining a velocity resolved map of the Horsehead Nebula in the [C II] line at 158 μm, and allocated 4.2 hours of Director's Discretionary Time for its execution.
The Horsehead Nebula (also known as Barnard 33) is a dark nebula and photodissociation region in the Orion Molecular Cloud Complex that is illuminated by the O9.5V star Sigma Orionis. The nebula and its surroundings have been studied extensively at many wavelengths using a wide variety of techniques. The fine-structure transition of singly-ionizedcarbon [C II] at 158 μm is the dominant cooling line for most of the interstellar medium. As such, it traces the interaction between the high-energy radiation from hot, recently formed stars and the surrounding interstellar medium from which they were born.
![Integrated [C II] line intensity over velocity range 9.5 – 11.5 km/s](/data/SOFIA/docs/sites/default/files/styles/wysiwyg_small/public/fig2.jpg)
Figure 2. Integrated [C II] line intensity over velocity range 9.5 – 11.5 km/s.
The Horsehead Nebula was observed on December 11, 2015 using the upGREAT Low Frequency Array (LFA) during SOFIA flight series OC3-M. The 12'x17' map obtained by SOFIA/upGREAT encompasses the iconic nebula itself and the underlying cloud ridge at an angular resolution of 15.1", and a velocity resolution of 0.19 km/s. The area covered by the upGREAT map is shown overlaid on an optical image (Fig. 1). The upGREAT integrated [C II] line intensity over the 9.5 - 11.5 km/s velocity range is shown in Figure 2, and a sequence of velocity channels are presented in the animated GIF image in Figure 3.
Instrument and Observations
Figure 3. upGREAT data
The upGREAT instrument is the SOFIA 2x7-beam dual-polarization heterodyne receiver for terahertz spectroscopy. It was built by the Max Planck Intitute for Radio Astronomy in Bonn and the KOSMA/ University of Cologne, Germany, under the leadership of Dr. Rolf Güsten. The improved inherent instrument sensitivity, the 14 independent detectors of upGREAT, and the increased mapping speed made possible by the inertially stable platform that SOFIA provides made these observations remarkably efficient. It is estimated that the equivalent map would have required over 200 hours of observing time using Herschel/HIFI, which would amount to a gain of almost a factor of 50 in mapping speed using SOFIA.
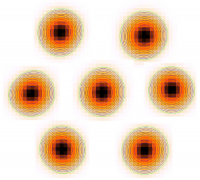
Figure 4. upGREAT Beam Pattern
The LFA has two sets (one per polarization) of 7 beams on the sky arranged in a filled hexagonal pattern (Fig. 4). It is designed to operate between 1.9 and 2.5 THz, and is currently optimized for the [C II] fine-structure line at 1.9005396 THz. Each mixer consists of a waveguide-based Hot Electron Bolometer with 4 GHz of bandwidth. The local oscillator signal for each polarization is fed via a beam splitter and a phase grating, which provide individual local oscillator beams. The intermediate frequency for these observations was 2000 MHz, with a typical receiver noise temperature, T_rx=1000 K (DSB) at the line frequency.
The region was observed in the On-The-Fly (OTF) Mapping mode with the scanning parameters optimized to minimize the effects of individual pixel variations and to provide a uniform sensitivity throughout the map. The reference (off-source) position used for the observations was (-733", +27.5") relative to the Horsehead position, RA=05:40:54.27, DEC=-02:28:00 (J2000). The telescope scan rate was about 18"/second and spectra were read out every 0.3-0.4 seconds in order to achieve a spatial sampling of about 6". (The average beam size for an LFA pixel is 15.1".) The entire 12'x17' mapped region was divided into four slightly overlapping sub-maps, each of which was observed twice at different array orientations. The total observing time for the map was 8 x 27.6 minutes = 220.8 minutes.
Data
An RA-DEC-Velocity data cube has been produced from the calibrated data by co-adding the individual spectra weighted by the inverse square of the root-mean-square baseline noise (1/(sigma_rms)^2.0). The spectral resolution has been re-binned to 0.193 km/s and the pixel scale to 7.5".
The data have no proprietary period and are available for download.
- Visit the SOFIA Data Archive at IPAC
- Under "Spatial Constraints", select "All-Sky"
- Under “Proposal Constraints”, enter “75_0015” into PlanID field
- Under “Data Product Constraints”, ensure that "Level 3" (for the GREAT release tarball) and “Level 4” (for the data cubes in FITS and CLASS (lmv)) are checked
- Select Search
Files describing the data:
Overview_project_75_0015.pdf
DataReduction_75_0015.pdf
Release_of_GREAT_Cycle3_Data_75_0015.pdf
Cycle3_GT_DDT_75_0015_EYoung_log.pdf