Signals on pure photospheres of stars at 160 micron are stronger than expected by about a factor of five. Review of the instrument design has revealed a weakness in the stray light control that could result in a short wavelength Ge:Ga response being detected in this band (due to scattering off a blocking filter).
For many types of observations, this light leak does not impact the data at all. Stars fainter than mJ ~ 5.5 mag will not be detectable in the leak above the confusion level. No compact extragalactic sources have mJ brighter than 5.5 mag. The leak signal for a star of mJ = -0.5 mag is equivalent to ~ 2.5 Jy at 160 micron. The parameter to consider for any given target is the 160 micron /2 micron flux density ratio. For a Rayleigh-Jeans source, this ratio is 0.0001. Anything with a ratio larger than 0.004 will produce uncorrupted data, so most objects will not be affected. Sources with 160 micron fluxes more than a factor of 40 above that of a Rayleigh-Jeans source from 1 - 1.6 micron will have leak signals <10% at 160 micron. Galactic programs on star formation, ISM, etc., will likely be impacted.
For stellar observations, the strongest signal apparent in a 160 micron observation is likely to be the leak itself. Tests were perfomed using HD 163588, a K2III star which is routinely observed at 70 micron and has also been observed at 160 micron. Similar results are obtained for HD 36673 (Arneb), an F0Ib star, and for HD 87901 (Regulus), a B7V star. The leak is 15±7 times as bright as the photosphere of a star.
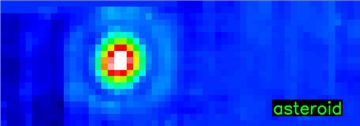
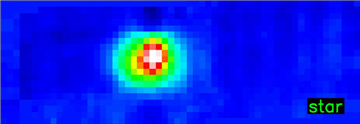
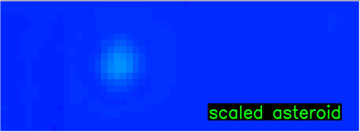
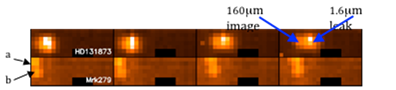
Figure 7.23 and Figure 7.24 show example 160 micron images of an asteroid and a star, respectively. The asymmetry apparent in the stellar image is a result of the short-wavelength light leak. Note that the brightest thing here is actually the leak; the star is the asymmetry to the bottom right, shown by itself in Figure 7.25. Figure 7.26 provides another view of the spectral leak, compared to a galaxy this time.
It has been demonstrated that observations of bright point sources strongly impacted by the leak (stars) can be corrected to a high level using an empirical stellar PSF and careful deconvolution (see, e.g., Stapelfeldt et al. 2004, ApJS, 154, 458). Best results will be obtained with observations for which proper planning and data acquisition was made to allow a good characterization of the leak signature for the object brightness and color. For example, plan to obtain identical observations of ''calibrator'' stars of similar type and brightness to your target stars, but without long-wavelength excesses.
Figure 7.23: 160 micron image of an asteroid; compare to next 2 figures. Note that this PSF is more symmetric than the stellar one in the next figure.
Figure 7.24: 160 micron image of a star; compare to previous and next figure.
Figure 7.25: Scaled asteroid - this is the brightness of the photosphere compared to the leak. (Compare to previous two figures.)
Figure 7.26: Another view of the spectral leak. The top row is 160 micron photometry observations of a star, HD131873, a K4 III (V=2.1, 160 micron flux of 0.66 Jy); it has a Rayleigh-Jeans spectrum. The bottom row is Mrk 279, a double galaxy (components are indicated as a and b). This is an extremely red object! Dithers in both cases are identical. The relative offset of the stellar image and leak is a function of position on the array.