- 2010 January 14 11:45:13 UTC to 2010 April 29 00:14:03 UTC
- Scans: 3,192
- Single-Exposures:
- Total number in all scans: 754,854
- Number of framesets used in Multiframe processing after quality and dynamic filtering (see V.2):
| W1 | 693,143 |
|---|---|
| W2 | 692,031 |
| W3 | 668,388 |
| W4 | 665,429 |
- Release Tile selection is described in V.2.b
- Nominal area covered in 10,464 Tiles: ~23,666 deg2 (57.4% of the sky)
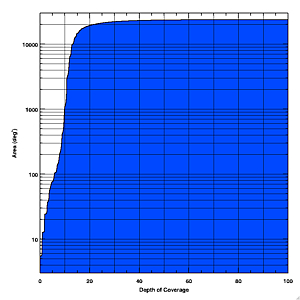
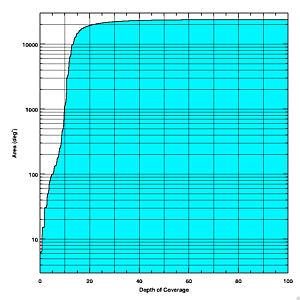
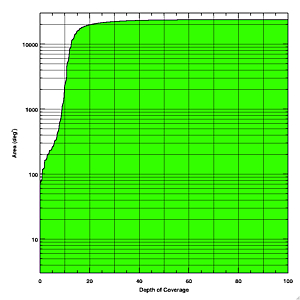
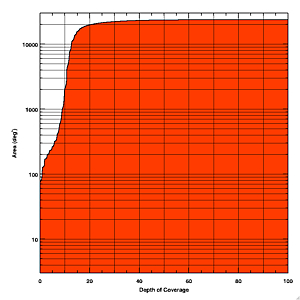
- Effective area covered as a function of Single-exposure depth-of-coverage in each band (see VI.2.b):
- The effective area of the Source Catalog is further reduced because of a 50" tile edge clearance requirement, and because of the the obscuring effects of bright stars (VI.2.c.ii).
 |
 |
| Figure 1- W1 | Figure 2- W2 |
 |
 |
| Figure 3 - W3 | Figure 4 - W4 |
| Cumulative histograms showing the effective area of the Preliminary Release as a function of Single-exposure depth-of-coverage in each band. | |
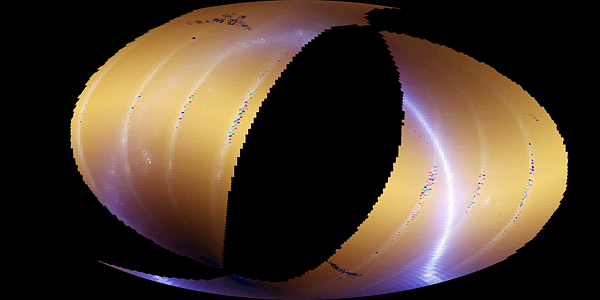 |
| Figure 5 - Aitoff equatorial projection showing a color composite Atlas Image mosaic covering the 10,464 Tiles in the Preliminary Data Release. Celestial north is towards the top and right ascension increases to the left. |
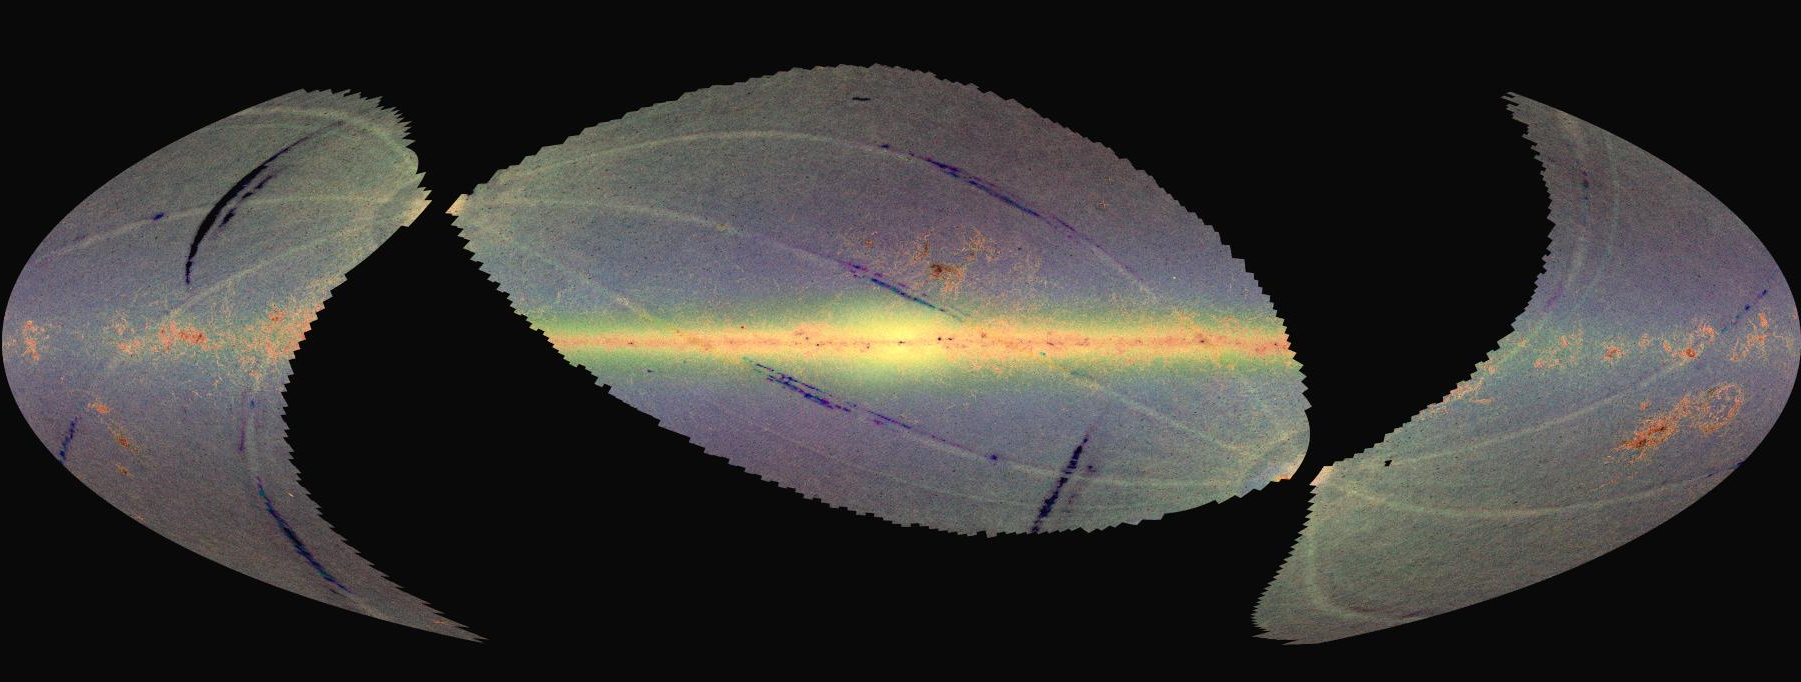 |
| Figure 6 - Hammer galactic projection showing a composite (W1-blue, W3-green, W4-red) surface density map in 0.2°x0.2° bins for the Preliminary Release Source Catalog. Galactic north is towards the top and galactic longitude increases to the right. |