Catalog Search Tool: Images
The Catalog Search Tool returns an image for orientation purposes as
part of the search results. This chapter covers the basics of that; visualization tools are covered in
another chapter. It can load images that are FITS  and HiPS
formats. Any catalogs you have loaded are
overlaid on the images; see visualization
chapter for more information.
and HiPS
formats. Any catalogs you have loaded are
overlaid on the images; see visualization
chapter for more information.
Contents of page/chapter:
+HiPS Images: General Information
+Coverage Image
+Upper Left HiPS menus
HiPS Images: General Information & Definitions
HiPS
stands for hierarchical progressive surveys, and these kinds of images
are multi-resolution HEALPix
images (where HEALPix stands for Hierarchical Equal Area isoLatitude
Pixelation). (Also see IVOA docs on HiPS .) In practice, what this means is that you can
interact with images of a very large chunk of sky, and as you zoom,
the pixel size changes dynamically. HiPS images are fundamentally
different than FITS images, and as such, what you can do with the HiPS
images are different than what you can do with the FITS images.
The whole point of HiPS images is to provide on-demand resolution
changes. Zoom out, and it loads large pixels. Zoom in, and it loads
smaller pixels. HiPS images are designed to cover large areas of sky
efficiently. If you need to visualize many degrees, this is the image
type to use.
There are HiPS images from all over the world available via the web;
the complete list of HiPS images available from the images search
page includes (once the "IRSA Featured" checkbox is unchecked) many
HiPS images from CDS .
HiPS images typically have the color and stretch set by the person who
originally made them. The color table can be remapped within this
tool. But, you cannot, in general, change the stretch of HiPS images
with as much flexibility as you can with FITS images. This is why
there may be multiple versions of some data sets in the list of HiPS
images.
HiPS maps typically come with a Multi-Order Coverage map
(MOC). A MOC is a
format developed by the International Virtual Observatory Alliance to
specify sky regions. In this context, a MOC tells you via a simple
boolean yes/no, is there sky coverage from this data set in this
region. You can overlay a MOC from one data set onto a completely
different data set's HiPS image.
The Catalog Search Tool provides for you a "coverage image", which is
basically a way for it (and you) to keep track of where you are
working on the sky. This is provided on the upper left of your search
results.
| You may have a coverage image like this -- this is
an example of a coverage image showing two different overlaid
catalogs. Note that in this case, the catalogs cover the whole sky,
so the HiPS image is displayed in HiPS/Aitoff projection to show the
whole sky. |  |
| You can
also have a coverage image like this, which shows a coverage image
that has polygons demonstrating the coverage of each a list of loaded
images (large polygons) and the locations of spectra (small squares).
This case only has data over a relatively small region, so the HiPS
image is zoomed in comparatively tightly on the relevant
region. |  |
| You might
have a coverage image something like this, which shows a coverage
image with a complex catalog overlaid. (This case still only has data
over a relatively small region, so the HiPS image is zoomed in
comparatively tightly on the relevant region.) In this case, the
catalog is more than 1000 sources, so the tool has shown you
individual sources in the HEALPix cells where there are fewer sources
than a given threshold, and where there are more sources, it simply
shows you the cell and the total number of sources in that cell. The
tool is rendering the catalogs in a
hierarchical fashion, similar to how HiPS images work. You can
control what this threshold is and how it renders the cells from the
layers pop-up.
| 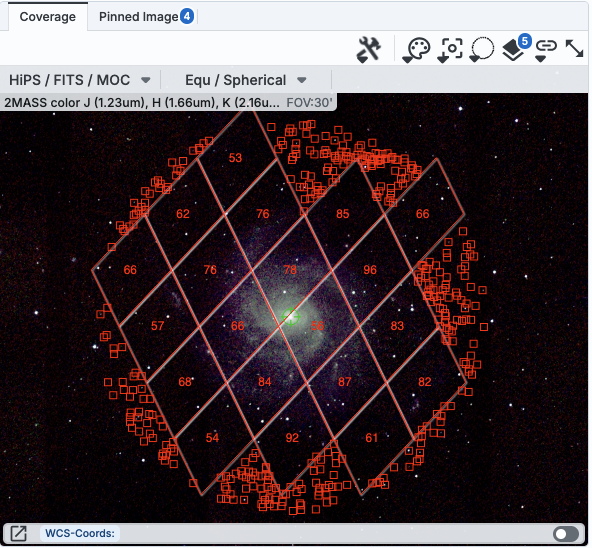 |
In all cases, you can interact with the coverage image in pretty much
exactly the same way as you would any other image loaded into this
tool; see the the visualization
chapter for much more about those tools.
The thing that makes a coverage image a little bit different, however,
is that it can automatically adapt, even beyond what a HiPS image can
intrinsically do. The next subsection includes more details about how
it can automatically change to accomodate your needs and zoom level.
In the upper left of the coverage image, there are two drop-down
menus.

The first drop-down menu looks like this.

There are two sections here.
- Under "Data Options", you can change what data are shown.
-
- Change HiPS: Changing HiPS images
- The choices made by any given creator of a HiPS image may result
in any particular region being saturated or too faint to see. Color
stretches are set by the creator of the HiPS map and cannot be
changed; color tables can be somewhat changed by this tool, but that
may be insufficient for your needs. If the HiPS map as shown does not
suit your needs and you wish to change the HiPS image, click on the
"HiPS/MOC" menu, and then click "Change HiPS". It brings up this
pop-up, which resembles the HiPS search
above:

Things to note:
- To select a new image, click on the row corresponding to the new
HiPS image you want, and click "Change HiPS" on the bottom left.
- To cancel without selecting a new image, click "Cancel."
- This is an interactive table, so all the filtering and column manipulation tools apply here
too. You can filter down the columns to find the image you want to
use.
- To learn more about each HiPS map, click on the i with the circle
in the second column. It will spawn another window with standardized
information about the HiPS map.
- By default, it shows HiPS maps corresponding to IRSA data
collections. To see a more comprehensive list, unclick the box marked
"IRSA Featured."
- Add MOC Layer: Adding a MOC Overlay
- It is often useful to see what other data are available. Looking
at a Herschel/PACS far-IR HiPS map? Overlay a MOC from a different
survey to see what complementary data might be available to go with
your IR data. Click on the "HiPS/MOC" menu, and then click "Add MOC
Layer." It brings up this pop-up:

Things to note:
- Coverage (the first column) is the fraction of the sky covered by
that MOC.
- To select a new MOC, click on the row corresponding to the new
MOC you want, and click "Add MOC" on the bottom left.
- To cancel without selecting a new image, click "Cancel."
- This is an interactive table, so all the filtering and column manipulation tools apply here
too. You can filter down the columns to find the image you want to
use.
- By default, it shows MOCs likely to be most interesting for IRSA
users. To see a more comprehensive list, unclick the box at the
top left.
- If you have your own MOC FITS file, you may upload it via the
"Use my MOC" tab on the top center.
- If you try to upload a MOC FITS file via the upload tab, it will behave as if you have
uploaded it here.
- Under "HiPS to FITS Conversion", you can control whether the viewer
will automatically toggle between image types as needed.
- By default,
the coverage image is most likely a HiPS image. FITS images are best
for small regions of the sky, and HiPS images are best for large
regions of sky.
- Auto Zoom-in to 2MASS K_s FITS:
- If you select this, then when you
zoom in very close to a target, it will automatically convert to a
FITS image when you get close enough.
- Switch to 2MASS K_s FITS image:
- If you select this, then it will
jump directly to a FITS image centered on the currently selected
target.
Note that if you swap between HiPS and FITS and back again, it
will include a region on the HiPS image that is the footprint of the
FITS images you had just loaded. A label appears at the center of that
footprint, which may be disconcerting if you are not zoomed out enough
to see the region itself. Here is an example, zoomed out so it is
more clear what is going on:

The second drop-down menu looks like this.

There are three sections in this menu.
- Orientation
- Under "Orientation", you can control whether the coordinates are
in Galactic or Equatorial J2000 (RA/Dec). This can be used in
conjunction with the image readout and/or the coordinate layer button
(both described in the visualization
section)
- Center Galactic
- If you select "Center Galactic", the HiPS image slews to put
Galactic North up, the Galactic Center in the center of the field of
view, and the Galactic Plane horizontally across your field of view.
This is useful if you have been zooming or scrolling around to look at
individual sources and need to bring it back to a familiar orientation
quickly.
- Projection
- Under "Projection", you can control whether the display is in
Spherical or Aitoff coordinates.
Aitoff projection works better for all-sky displays.