IRAS Explanatory Supplement
IV. In-Flight Tests
A. Detector/Focal Plane Performance
Table of Contents | Index | Previous Section | Next Section
- Detector Sensitivity and Responsivity
- Detector Reliability and Anomalies
- Cross-scan Response
- Verification of Linearity
- Baseline Stability
- Particle Radiation Effects
- Effects of Bias Boost
- Photon Induced Responsivity Enhancement
- Feedback Resistor Nonlinearity Analysis
A.1 Detector Sensitivity and Responsivity
Although the performance of the individual detectors was quite uniform during the course of the mission, there was a range of sensitivities within each wavelength band. The noise equivalent flux density (NEFD) was calculated for each operating detector to quantify this spread. Five-minute long segments of data taken at high galactic latitude away from regions of obvious infrared cirrus were used to calculate the NEFD of each detector. After a baseline was subtracted from the data, a Gaussian noise estimator that discriminated against point sources was used to estimate the 1 rms noise
in a single data sample. NEFD's from six representative SOPs were
averaged together to give a single estimate of the noise in each detector.
The NEFD for a given detector varied by less than 25% for the data
examined.

|
|
Figure IV.A.1 A histogram of noise equivalent flux densities under
quiescent conditions. The detector number is indicated in each box.
The absolute calibration is discussed in Chapter IV. The
"noisy" detectors were excluded from the means. larger largest |
The results of this analysis are shown in the histograms of Fig. IV.A.1a-d which give the NEFD's of each detector.
A mean noise for
the band was calculated by leaving out those few detectors that were
significantly noisier than their siblings. It should be pointed out that
since a point
source contributes to three data samples, two of which have weights
of 0.5, the noise in the bandwidth appropriate to a point source is
approximately
 1.5 smaller than the values quoted in
the figure. As discussed
in Chapter V.A.3.c, however, the
signal-to-noise
ratio quoted throughout the data processing is based on the single
sample
noise.

|
|
Figure IV.A.2 Histogram of the distribution
of the uncorrected responsivities of the
individual detectors for each wavelength
band. The responsivities were found from the
amplitudes of the response relative to
flashes from the internal reference source
obtained at the start and end of each survey
scan. Responses to the latter under stable
conditions had a dispersion of less than
2%; see Section IV.D. larger largest |
The absolute calibration procedure used to derive these numbers is described in Chapter VI. Degradations of the sensitivity due to high photon backgrounds, to electron hits on the detectors in the polar horns of the Van Allen belts, to cosmic rays and to proton hits in the South Atlantic Anomaly (the SAA) are discussed below.
The detector responsivity and sensitivity depend on the
background photon and particle environment. The responsivity as a
function of time was determined
by comparison with flashes from the internal reference source which
was shown to be stable to better than 2%
(Section IV.D).
Figure IV.A.2 shows histograms of the
distribution of the responsivity of each detector, normalized to the mean
of the entire mission, as measured throughout the flight. The small intrinsic
dispersion of the responsivities in the shorter wavelength bands is evidence
that the changes in the uncorrected sensitivity from scan to scan were not
extreme.
A.2 Detector Reliability/Anomalies
Throughout the mission the performance of the infrared detectors was very stable. Most detectors exhibited their pre-launch behavior. Detectors 17, 20 and 36 remained dead. Power spectra of detector data streams revealed that many of the detectors, especially the 12 µm and 25 µm detectors, were subject to low level 1 Hz electronic cross talk from the temperature sensors in the focal plane. Only for detectors 19 and 43 did the cross talk exceed the rms noise. In addition, detector 5 (100 µm) was subject to 0.25 Hz cross talk from an engineering data multiplexer. These three detectors had shown no excess noise before launch. As described in Section VI.A.4 it proved possible to either remove (in the case of detector 5), or to greatly reduce (detectors 19 and 43) the detrimental effects with the ground software.Detector 26 exhibited a factor of three more noise than normal in the periods 1983 February 2-10 (SOPs 17-33) and 1983 March 16-June 6 (SOPs 101-265) for unknown reasons. Detectors 25 and 42 were generally a factor of two to three times noisier than other detectors in their bands. Detector 28 showed an abnormal cross-scan response as discussed below. These detectors were sufficiently noisy to be declared "failed" in the processing as discussed in Section V.D.2.d.
A.3 Cross-scan Response
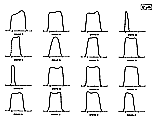
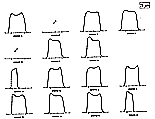
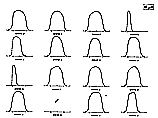
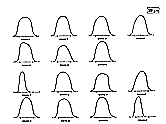
The variations in individual detector responsivity with position across the detector were measured by scanning a celestial point source over closely spaced tracks across the focal plane. Four or five different cuts across a full width detector could be measured in this way. The results from the scans of the planetary nebulae NGC6543 are shown in Fig. IV.A.3.1- 3.4. The individual data points have been normalized to the peak response for each detector and a certain amount of artistic license was used to draw the solid curve representing the cross-scan response. Table IV.A.1 gives the effective solid angle of each detector based on the measured cross-scan and in-scan response.
Detector 28 had abnormal cross-scan response and was declared
failed for seconds-confirmation purposes (Section
VII.D).
A.4 Verification of Linearity
|
|
Figure IV.A.3.1 Cross-scan profiles of each 12 µm detector
deduced from scans across NGC6543. The measurements were
made in the pointed mode where cross scan position is well known.
Each scan has been normalized to unity at its peak value. larger largest |
The responsivity of infrared detectors can depend on their frequency response and on the total amount of infrared radiation falling on them. In-flight tests were conducted to investigate the importance of these effects. Necessarily, the two types of tests were often coupled and the results were not always unambiguous.
The effect of the total photon flux on the responsivity was
measured by repeatedly observing asteroids as they approached the lunar limb
to within 3°, making use of the out-of-field stray radiation from
the moon. The highest background levels reached by this technique were
5, 4, 9 and 34 times the zodiacal background in the ecliptic plane. The test
was thus overly severe in the 12 and 25 µm bands
where the flux in the zodiacal bands represented the maximum background.
The tests were adequate at the longer wavelengths where the background flux
in the Galactic plane exceeds that in the ecliptic. The internal reference
source was flashed immediately before and after each observation at the
same background level.
|
|
Figure IV.A.3.2 Same as Figure IV.A.3.1, except for 25 µm. larger largest |
|
|
Figure IV.A.3.3 Same as Figure IV.A.3.1, except for 60 µm. larger largest |
|
|
Figure IV.A.3.4 Same as Figure IV.A.3.1, except for 100 µm. larger largest |
| Band | Det # | Solid Angle [10-7 sr] |
Cross-Scan** Dispersion % |
Solid Angle Det # |
Cross-Scan [10-7 sr] |
Dispersion % |
|---|---|---|---|---|---|---|
| 100 µm | 1 | 14.5 | 9 | 55 | 7.1 | 11 |
| 2 | 12.7 | 9 | 56 | 14.0 | 9 | |
| 3 | 13.0 | 10 | 57 | 13.2 | 8 | |
| 4 | 11.53 | 13 | 58 | 11.2 | 15 | |
| 5 | 12.0 | 11 | 59 | 11.7 | 14 | |
| 6 | 12.4 | 12 | 60 | 13.3 | 11 | |
| 7 | 12.6 | 10 | 61 | 13.5 | 11 | |
| 62 | 10.6 | 10 | ||||
| 60 µm | 8 | 7.2 | 9 | 31 | 2.1 | 9 |
| 9 | 6.7 | 9 | 32 | 6.4 | 9 | |
| 10 | 6.6 | 10 | 33 | 5.9 | 9 | |
| 11 | 2.8 | 9 | 34 | 6.5 | 12 | |
| 12 | 4.3 | 9 | 35 | 6.3 | 13 | |
| 13 | 6.6 | 14 | 36 | -- | -- | |
| 14 | 6.1 | 12 | 37 | 6.6 | 11 | |
| 15 | 6.2 | 10 | 38 | 3.9 | 14 | |
| 25 µm | 16 | 3.5 | 4 | 39 | 1.4 | 7 |
| 17 | -- | -- | 40 | 3.1 | 7 | |
| 18 | 3.6 | 7 | 41 | 3.1 | 6 | |
| 19 | 2.8 | 4 | 42 | 3.4 | 6 | |
| 20 | -- | -- | 43 | 3.2 | 6 | |
| 21 | 2.8 | 12 | 44 | 3.2 | 6 | |
| 22 | 3.1 | 9 | 45 | 3.2 | 7 | |
| 46 | 2.4 | 7 | ||||
| 12 µm | 23 | 2.9 | 7 | 47 | 0.77 | 4 |
| 24 | 3.0 | 4 | 48 | 3.1 | 6 | |
| 25 | 3.2 | 4 | 49 | 2.9 | 6 | |
| 26 | 1.2 | 9 | 50 | 3.0 | 7 | |
| 27 | 2.0 | 8 | 51 | 2.7 | 6 | |
| 28 | 3.1 | 37 | 52 | 2.5 | 7 | |
| 29 | 2.5 | 22 | 53 | 2.8 | 7 | |
| 30 | 2.8 | 10 | 54 | 2.0 | 8 | |
| * Solid angle based on the measured
detector
cross-scan response. In-scan response based on average point source detector template. |
||||||
| ** Cross-scan dispersion is the
uncertainty
in the flux assigned to a single detection due to the fact that the detector cross-scan response is not uniform, but the source crosses the detector with uniform probability in the non-overlap region. |
||||||
The frequency response was measured by scanning a given source
at rates varying from the nominal scan rate (3.85' s-1) to 1/16
the nominal scan rate. In addition, the internal reference source was
observed for varying lengths of time up to 120 seconds. Finally, selected
sources were observed in the "stare" mode with one detector
being positioned on the source for up to 120 seconds; this procedure was
never successfully executed using a 25 µm detector.

|
|
Figure IV.A.4.1 Measurements of the response vs. dwell
time to measure frequencey dependence of the detectors at 12 (left
panel) and 25 (right panel) µm. The measurements were made
either by crossing a source at scan rates less than the survey rates or by
viewing long flashes of the internal reference source. larger largest |
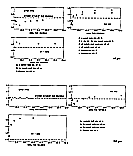
In Figure IV.A.4.1,2 the results of the
tests to measure the dependence of the responsivity with frequency are
given for the four IRAS bands. The ratio of the responsivity at nominal
survey scan speed to that at "DC" was adopted as 0.78, 0.82, 0.92
and 1.0 at 12, 25, 60 and 100 µm; these ratios are indicated
in the figures
|
|
Figure IV.A.4.2 Measurements of the response vs. dwell
time to measure frequency dependence of the detectors at 60 (top
panels) and 100 (bottom) µm. The measurements were made
either by crossing at scan rates less than the survey rates or by viewing
long flashes of the internal reference sources. larger largest |
The test also show that, at the 5% level, there was, at 12 and 25 µm,
no effect of the source strength on the dependence of the
responsivity with frequency. The "mean" observations in the figures
represent stars whose amplitudes span more than a factor of 100 in brightness
and which show no significant departure from the curves shown. At 60
and 100 µm the situation is clearly different. Tests of sources up
to 10 times brighter than  -Lyr show the
same behaviour as does
  -Lyr. Stonger
sources show a variety of behaviors as indicated in the figures.

|
|
Figure IV.A.5 Measurements at survey and ½ survey scan
speeds. The magnitude scale is defined in Section VI.C.2.a.
The source IRC+10216 is at the extreme left in both panels. larger largest |
Of particular interest is the frequency dependence between
observations at the survey rate and observatioan taken at half survey rate
since the latter rate was used in pointed observations, some of which were
crucial in the absolute calibration procedure. In Fig.
IV.A.5 the magnitude differences between the observations at the survey
rate and at ½ survey rate are given for sources of varying
strengths.
A.5. Baseline Stability
The electronic baseline stability proved to be quite good on a time scale of a day, with drifts typically less than 5% of the sky brightness toward the north ecliptic pole over this period at 12 and 25 µm and less than 20% at 60 and 100 µm. Throughout the mission, baseline drifts over periods longer than about one day were monitored by daily observations of a region of the sky near the north ecliptic pole which was called the Total Flux Photometric Reference (TFPR). A detailed discussion of the determination of the brightness of this region and its time variation is given in Section VI.B.3. Additional differential effects between detectors which were improtant in the extended emission maps were removed in the destriping processor described in Section V.G.6.A.6. Particle Radiation Effects
In order to minimize the expected degredation of the data quality due to energetic particle radiation, the IRAS hardware incorporated a number of features including nuclear shielding, radiation hit deglitchers, radiation hit deadtime counters and bias boost circuits; see Section II.C. In addition, operational procedures were developed during the in-orbit checkout phase to minimize radiation effects. These procedures were incorporated into the routine mission procedures (see Section III.B.6 and III.C.4).A.6.a Detector Responsivity and Noise
The radiation effects from the horns of the van Allen belts were basically limited to an increase, typically by a factor of two or less, in noise due to many small pulses not eliminated by the deglitcher circuitry. Passage through the SAA caused large changes to the detector responsivity particularly in the 60 and 100 µm bands. These were monitored by comparisons with flashes from the internal reference source after passage through the SAA. Cosmic ray hits at the rate of about one per twenty seconds on each detector were handled adequately by the nuclear spike deglitchers and caused little degradation to the data (Section VII.D).A.6.b Radiation Effects on Detector Baselines
Ionizing radiation in the IRAS environment affected the baseline stability in two ways. Residual noise spikes from polar horn passage and entry into the edges of the SAA were not removed from the data, and when added into the extended emission maps resulted in elevation of the baseline and increased noise. The radiation level was monitored by using the activation of the nuclear particle circumvention circuit as described in Section III.D.2, and data taken during times of high radiation levels (blanking time greater than 10%) were excluded from the extended emission data base.
A.7 Effects of Bias Boost

|
|
Figure IV.A.6 Effect of bias boost on responsivity after
passage through SAA. The responsivity was measured by comparison
with repeated flashes of the internal reference source. For clarity,
the 25, 60 and 100 µm observations have been
shifted by arbitrary amounts. larger largest |
The bias boost (Sections II.C.5 and
III.B.6) applied to the 60 and 100 µm
detectors to minimize radiation
exposure effects during deep SAA passages reduced the responsivity
and noise as expected from the pre-flight measurements. The change in
the responsivity of the 25 µm detectors was sufficiently small that no
bias boost in that band was regularly applied. Figure
IV.A.6 shows the mean response to the internal reference source from the
detectors of each of the four IRAS bands as function of time before and after
two consecutive SAA crossings of more than average radiation dosage
using the bias boost procedures developed during in-orbit checkout. It can be
seen that the responsivity was stable to within 5% - 10% in the 12 and 100
µm bands, about 15% in the 25 µm band and better than 5%
in the 60 µm band.
The bias boost also resulted in a baseline shift significantly larger than described in Section IV.A.5 which decayed exponentially with time. The details of this behavior were measured by special observations and analysis; a complete description is given in Section VI.A.3. There were times when the track of the satellite went near the boundary of the SAA, but when no bias boost was applied. If the internal reference source was activated near the SAA in these cases, errors in the responsivity as large as 8%, which resemble baseline errors, affected all detectors in the band. These produced increased apparent brightness at 12, 25 and 60 µm and decreased apparent brightness at 100 µm.
A.8 Photon Induced Responsivity Enhancement
After the mission was completed, a comparison of scans which crossed the Galactic plane in an ascending manner with those crossing it in a descending manner showed an enhancement in the responsivity in the 100 µm detectors due to passage through the Galactic plane.

|
|
Figure IV.A.7 Observations of photon induced responsivity
enhancement in the 100 µm detectors after scans of Saturn. The
response for the three detectors #3, 6 and 7 are plotted separately; the
responses of the other 100 µm detectors are averaged. larger largest |
Subsequent analysis of special calibration scans over Saturn confirmed
that this effect was due to responsivity enhancement caused by infrared
photons. During these special observations, Saturn was scanned across the
focal plane ten times with an integrated photon dose on the 100 µm
detectors ranging up to 12 × 10-10 Joules (X) m-2.
The enhancement associated with this photon dose was defined as the ratio
of the amplitude of the internal reference source after the observation
to the amplitude of the flash prior to the observation. The results are
shown in Fig. IV.A.7. The 100 µm detectors
3, 6, and 7 show little enhancement while the rest of the 100 µm
detectors show an enhancement increasing with increasing dose to about
13% enhancement at about 9 × 10⁻¹⁰ Joules m-2.

|
|
Figure IV.A.8 Observations of the decay of photon induced responsivity
enhancement after scans over Saturn. The response was
measured using flashes of the internal reference source and is
normalized to the flash amplitude which just preceded the scan over
Saturn. The Saturn crossing occurred between 0 and 300 seconds. larger largest |
Figure IV.A.8 illustrates how the response to
the internal reference source decayed with time after a Saturn exposure.
Each amplitude of the flash from the internal reference source has been
normalized to the amplitude from the source flash that preceded the Saturn
exposure. This was done for three observations following a Saturn observation.
Care was taken to ensure no bias boost occurred between these observations.
Of course, there is no guarantee that the response of the detectors to
the internal reference source was not affected by photon exposure within
these post Saturn observations.

|
|
Figure IV.A.9 Typical photon dosages in the 100 µm detectors for
45° crossings of the Galactic Plane. The dosages were calculated from
the mean surface brightness within 20° of the Galactic plane in 0.5°
intervals. larger largest |
Figure IV.A.9 shows the integrated 100 µm
photon dose due to the Galactic plane emission as a function of ecliptic
longitude for a nominal scan inclination of 45° with respect to the
Galactic plane. The integrated photon dose is generally in the range of
dosages encountered in the Saturn observations with peak dosage near the
Galactic center being approximately twice the peak Saturn dosage. No
significant enhancement was observed for the 12, 25 or 60 µm
detectors in the Saturn observations.
The statistical analysis of the effect of photon induced responsivity enhancement cause by passage over the Galactic plane is discussed in Section VI.B.4.c.
A.9 Feedback Resistor Nonlinearity Analysis

|
|
Figure IV.A.10 Comparisons of 12 and 25 µm IRAS pointed
observations with ground based observations over a wide range of
magnitudes (Section VI.C.2.a) to check
nonlinearity of the feedback resistor. The ground based observations
of standard stars are from Rieke et al.
(1984) (open circles) and from Tokunaga
(1984) (closed circles). The offsets reflect a zero point difference
of 0.02 mag used by Tokunaga and the fact that both ground based
systems adopt zero color difference between 10 µm and 20
µm, whereas a color difference of 0.03 mag has been adopted
for the IRAS calibration. See Section VI.C.
The ground observations of IRC+10216 are by Joyce
(1984); see Section IV.A.9). larger largest |
The impedance of the detector feedback resistors, nominally 2 ×
1010  decreases with
increasing voltage as shown in Fig.
II.C.2. The shape of the resistance versus voltage relation for the
feedback resistors was verified by (a) comparing fluxes for stars
measured at 12 and 25 µm with ground-based observations (Tokunaga 1984; Rieke et al., 1984) and (b) special
low gain calibration observations of IRC+10216. Since IRC+10216 is known to
be variable, the latter were compared with nearly simultaneous 10 µm
ground-based observations
(Joyce, 1984). The results for the 12
and 25 µm bands are shown in Fig. IV.A.10.
In this test the 25 µm comparison value for IRC+10216 was estimated
from the published spectral distribution
(Campbell et al., 1976)
normalized to the 12 µm measurement Detector-to-detector differences
in the Rf shape were assessed by comparison of detector response ratios.
There appears to be no significant deviation from the adopted
Rf vs. voltage curve over the range examined. Furthermore,
there appears to be no source strength dependent term larger than a few
percent in the 12 and 25 µm bands.
Similar tests for the 60 and 100 µm bands were not carried
out due to uncertainty in the 60 and 100 µm flux from IRC+10216
at the time of the IRAS observation and the lack of bright, pointlike
isolated sources well observed with other telescopes which were also
observed with IRAS calibration observations.
Table of Contents | Index | Previous Section | Next Section