ISSA Explanatory Supplement
IV. ANALYSIS RESULTS
B. Positional Accuracy
IV. ANALYSIS RESULTS
B. Positional Accuracy
Positional accuracy and small source photometric consistency were studied using point sources selected from the IRAS Point Source Catalog to be bright enough to measure easily in the ISSA data and to be free of interference from extended emission or nearby point sources. Point sources at 12 and 25 µm were selected to be at high Galactic latitude, |b|>30°, with brightness between 5 and 55 Jy and correlation coefficients of 0.99 or greater. The 23 sources at 12 µm and 24 sources at 25 µm are listed in Table IV.B.1. Point sources at 60 and 100 µm were selected from the IRAS galaxy list (Soifer et al., 1987) to have a large radial velocity (>4000 km s-1) with brightness between 5 and 55 Jy. The velocity criterion is designed to select small angular diameter galaxies unlikely to be extended at the resolution of the ISSA maps. The 14 sources at 60 µm and 15 sources at 100 µm are listed in Table IV.B.1.
| 12 µm | 25 µm | 60 µm | 100 µm | ||||
|---|---|---|---|---|---|---|---|
| IRAS Name | Field | IRAS Name | Field | IRAS Name | Field | IRAS Name | Field |
| 00515-6308 | 25 | 00515-6308 | 25 | 00163-1039 | 162* | 00163-1039 | 162* |
| 01452-8026 | 3 | 01452-8026 | 3 | 02228-2500 | {1}98 | 02228-2500 | {1}98 |
| 02039-5722 | 26 | 02039-5722 | 26 | 04315-0840 | 169* | 04315-0840 | 169* |
| 02110-7143 | 11 | 02110-7143 | 11 | 04461-0624 | 169* | 04461-0624 | 169* |
| 02238-5947 | 26 | 02238-5947 | 26 | 05189-2524 | 135 | 05189-2524 | 135 |
| 03040-8013 | 3 | 03040-8013 | 3 | 08354+2555 | 316* | 09320+6134 | 397 |
| 03336-7636 | 3 | 03336-7636 | 3 | 09320+6134 | 397 | 09437+0317 | 213* |
| 05150-4056 | 73 | 04330-6307 | 28 | 10565+2448 | 319* | 10565+2448 | 319* |
| 05174-3345 | 102 | 05150-4056 | 73 | 12540+5708 | 399 | 12540+5708 | 399 |
| 05217-3943 | 73 | 05174-3345 | 102 | 12590+2934 | 322* | 12590+2934 | 322* |
| 05345-4406 | 73 | 05217-3943 | 73 | 13136+6223 | 399 | 13136+6223 | 399 |
| 10416+6740 | 414 | 05345-4406 | 73 | 13136+6223 | 400 | 13136+6223 | 400 |
| 10521+7208 | 414 | 10416+6740 | 414 | 13183+3423 | 322* | 13183+3423 | 322* |
| 11284+6936 | 415 | 10521+7208 | 414 | 23488+2018 | 270* | 23488+2018 | 270* |
| 15448+3828 | 355 | 11284+6936 | 415 | 23591+2312 | 270* | 23591+2312 | 270* |
| 15566+3609 | 355 | 15448+3828 | 355 | ||||
| 16164+5952 | 402 | 15566+3609 | 355 | ||||
| 16342+6034 | 402 | 16164+5952 | 402 | ||||
| 17126+3625 | 357 | 16342+6034 | 402 | ||||
| 17133+3651 | 357 | 17126+3625 | 357 | ||||
| 17329+5359 | 383 | 17133+3651 | 357 | ||||
| 17403+6234 | 403 | 17329+5359 | 383 | ||||
| 17403+6234 | 403 | ||||||
| 20427-8243 | 9 | ||||||
|
|
|
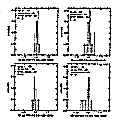
Figure IV.B.1(a) Histograms of Position Differences in
RA Between PSC and ISSA larger largest |
The position accuracy analysis consisted of comparing the
apparent position of the selected sources in the ISSA maps with
the published source locations in the IRAS Point Source Catalog.
The ISSA position was taken
to be the photocenter of the source in the ISSA map.
Photocenters were obtained by producing a flux-weighted average of
the pixel positions over a circular region surrounding a source
after subtraction of a local background.
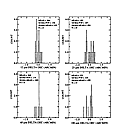
Figures IV.B.1(a) and
IV.B.1(b) display
histograms of difference between the PSC position and the ISSA
position for the selected point sources. Table IV.B.2
summarizes the
statistics obtained from the histograms. The mean position
differences between the PSC and ISSA are less than 0.1 pixel
(9") and the expected position uncertainty of a
single source is less than 0.2 pixel (18").
|
|
|
Figure IV.B.1(b) Histograms of Position
Differences in DEC Between PSC and ISSA larger largest |
| 12 µm | 25 µm | 60 µm | 100 µm | |
|---|---|---|---|---|
| # of Sources | 23 | 24 | 14 | 15 |
| Mean Delta R.A. (') | 0.004 | 0.001 | 0.040 | 0.031 |
| sigma(Delta R.A.) (') | 0.156 | 0.267 | 0.179 | 0.224 |
| Mean Delta Dec. (') | 0.070 | 0.034 | -0.078 | -0.131 |
| sigma(Delta Dec.) (') | 0.126 | 0.225 | 0.156 | 0.236 |

