ISSA Explanatory Supplement
IV. ANALYSIS RESULTS
C. Point Spread Function
IV. ANALYSIS RESULTS
C. Point Spread Function
|
|
|
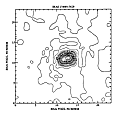
Figure IV.C.1(a) Contour Plot of Point Spread
Function for a 12 µm Source, Contoured from 0.0 to 13.6, Interval 0.8 larger largest |
|
|
|
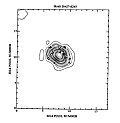
Figure IV.C.1(b) Contour Plot of Point Spread
Function for a 25 µm Source, Contoured from 4.0 to 11.6, Interval 0.4 larger largest |
|
|
|
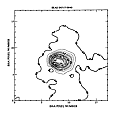
Figure IV.C.1(c) Contour Plot of Point Spread
Function for a 60 µm Source, Contoured from 0.0 to 18.0, Interval 1.0 larger largest |
|
|
|
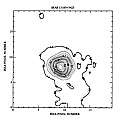
Figure IV.C.1(d) Contour Plot of Point Spread
Function for a 100 µm Source, Contoured from 0.0 to 12.0, Interval 0.8 larger largest |
| IRAS Name | Field | Flux (Jy) | FWHM (arcmin) | |
|---|---|---|---|---|
| 12 µm | 10521+7208 | 414 | 35.6 | 3.7× 4.8 |
| 15448+3828 | 355 | 37.0 | 3.7× 4.9 | |
| 17133+3651 | 357 | 48.2 | 3.6× 5.3 | |
| 05174-3345 | 102 | 27.3 | 3.6× 4.7 | |
| 03040-8013 | 3 | 26.2 | 3.6× 4.7 | |
| 25 µm | 20427-8243 | 9 | 12.6 | 3.6× 4.6 |
| 01452-8026 | 3 | 20.8 | 4.5× 4.9 | |
| 17329+5359 | 383 | 21.4 | 3.6× 5.3 | |
| 04330-6307 | 28 | 12.1 | 3.5× 3.9 | |
| 02238-5947 | 26 | 12.1 | 3.8× 4.6 | |
| 60 µm | 08354+2555 | 316 | 24.3 | 3.7× 4.2 |
| 00163-1039 | 162 | 6.9 | 2.7× 3.9 | |
| 04315-0840 | 169 | 33.5 | 3.5× 4.6 | |
| 23488+2018 | 270 | 17.0 | 3.2× 5.2 | |
| 100 µm | 13183+3423 | 322 | 24.4 | 4.5× 4.8 |
| 10565+2448 | 319 | 14.3 | 4.6× 5.2 | |
| 23488+2018 | 270 | 21.0 | 5.2× 6.1 | |
| 09320+6134 | 397 | 20.1 | 4.8× 5.2 |


