Appendix 3. Long Exposure (6x) Scan Databases, Catalogs and Images
1. Overview of the Long Exposure (6x) Observations and Data Products
b. Relationship to Main 2MASS Survey
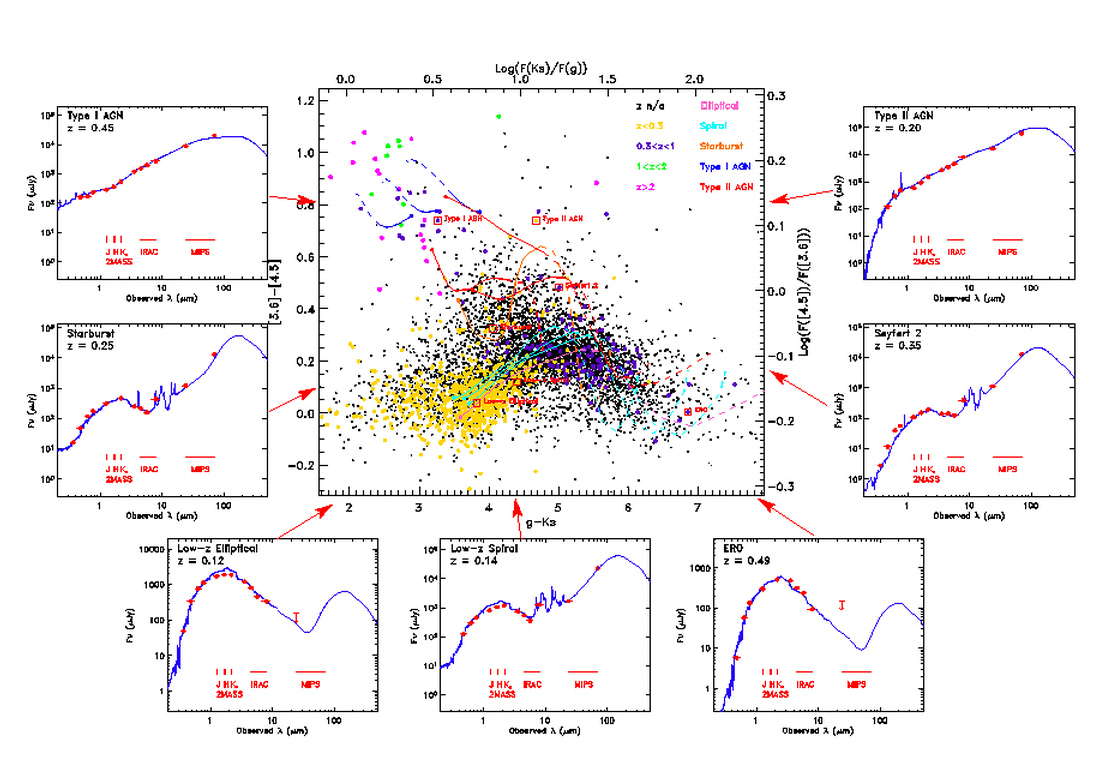
Figure 4 - Color-color diagram and spectral energy distributions made by combining visible, 2MASS 6x-PSC and Spitzer/IRAC photometry from the SWIRE Legacy program

The 2MASS/SWIRE Catalog (courtesy of M. Polletta)
About 19,000 SWIRE sources in the Lockman Hole are found in the 2MASS 6x Point Source Catalog. 64% of the sources are either stars or saturated optical sources. Spectroscopic redshifts are available for 971 sources and range from 0.007 to 3.4. The peak of the redshift distribution is at z=0.12 and 90% are below z=0.4. Some of these data have been used by Polletta et al. (2006 ApJ, 642, 673).
Using 2MASS 6x Data
2MASS 6x data, in combination with the SWIRE data, can be used to characterize different types of sources, e.g. normal and active galaxies, constrain their redshift, improve photometric redshifts and measure stellar masses.
An example: diagnostic tool for source characterization and redshift determination
The central portion of Figure 4 shows a color-color diagram which combines the optical g-band with the 2MASS 6x Ks-band data, g-Ks, and two IRAC bands data, 3.6 and 4.5 μm. All of the 2MASS and SWIRE sources detected in the four bands are shown as dots. Different colors are used to indicate different redshift ranges, yellow for z<0.3, purple for 0.3<z<1, green for 1<z<2, magenta for z<2 and black if a spectroscopic redshift is not available. Tracks of galaxy templates from z=0.001 to z=1 are also shown, elliptical in pink, spirals in cyan, starburst in orange, type I AGN in blue and type II AGN in red. A solid curve refers to z=0.001-0.3 and a dashed curve to z=0.3-1.
This color-color diagram can be used to distinguish different galaxy types and redshift ranges. The g-Ks color is very sensitive to redshift in galaxies where the optical/near-IR spectrum is dominated by starlight. Active (AGN and starbursts) and normal (elliptical and spirals) galaxies with g-Ks<5 occupy two distinct regions in the plot, the former being redder in the near-IR.
Normal galaxies (elliptical and spirals) comprise the majority of the 2MASS/SWIRE population. They form a distinct sequence with a peak in the [3.6]-[4.5] color at z=0.3. The spectral energy distributions (SEDs) of an elliptical and spiral galaxy at low-redshift are displayed in the bottom panels. Sources with large g-Ks colors are Extremely Red Objects (ERO). An example of ERO is shown on the bottom right panel.
Starburst galaxies show g-Ks colors similar to those of normal galaxies (ellipticals and spirals), but they are redder in the near-IR at z<0.3. The SED of a starburst galaxy is shown on the middle left panel.
Type I AGN occupy the upper left corner with blue g-Ks
colors and red
[3.6]-[4.5] colors, type II AGN show redder g-Ks colors (>3)
than Type I AGN,
but can be as red in the IR. The SEDs of three AGN are shown on the the
top-left panel and on the two upper right panels.
[Last Updated: 2006 October 6; by M. Polletta]
Back to A3.1