Appendix 3. Long Exposure (6x) Scan Databases, Catalogs and Images
1. Overview of the Long Exposure (6x) Observations and Data Products
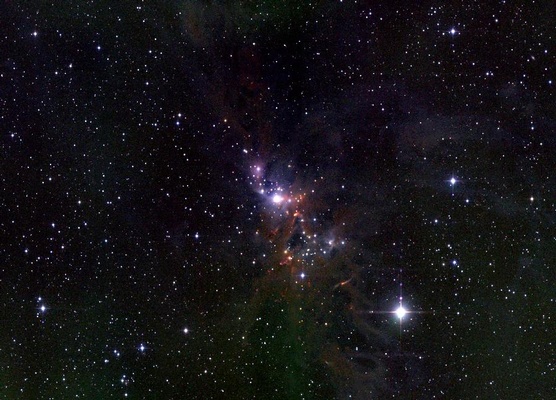 |
| J/H/Ks color composite of NGC1333 in the core of the Perseus 6x field |
During the final months of 2MASS observatory operations, a campaign of targeted "long exposure" observations was carried out during times when no previously unscanned parts of the sky were available for the main survey. These observations used the same freeze-frame scanning technique employed for the survey, but with READ2-READ1 exposures six times longer than was used for normal survey observations (hence they are referred to as "6x" observations). The 2MASS 6x measurements were intended to probe ~1 magnitude deeper than the main survey in unconfused regions.
Approximately 590 deg2 of sky distributed in 30 targeted regions were scanned at least once using the long exposures. Most of this area is concentrated in two large, comprehensive surveys of the Large and Small Magellanic Clouds, 383 deg2 and 127 deg2, respectively. Twenty-eight additional smaller fields were mapped in the 6x mode from both observatories, covering targets that include the Pleiades open cluster, galactic star formation complexes, M31, nearby galaxy clusters and the Lockman Hole.
The raw 6x imaging data were reduced using a version of the 2MASS Production Processing System (2MAPPS) that was modified to accommodate the longer exposure times and other characteristics of the 6x data. The modifications to the processing pipeline, and features unique to the 6x data processing are described in A3.5. Data processing produced a 6x Image Atlas and 6x point and extended source Working Databases (6x-PSWDB and 6x-XSWDB), analogous to those from the main survey. "Catalogs" of point and extended source detections (6x-PSC and 6x-XSC) that represent uniform, higher reliability single-epoch snapshots of the near infrared sky were drawn from the 6x WDBs using SNR and quality criteria similar to those used to construct the All-Sky Release PSC and XSC (A3.6.c). The 6x-PSC and 6x-XSC have not received the same level of scrutiny and validation as the 2MASS All-Sky PSC and XSC, though.
Accessing the 2MASS 6x Catalogs/Working Databases
Unlike the All-Sky Release Catalogs, the 6x Catalogs are not released as separate tables. The 6x Point and Extended Source Catalogs are instead integrated into the respective 6x Point and Extended Source WDBs. Sources comprising the Catalogs are denoted in the WDBs with the cat flag, and have cat="1".
Access to the 2MASS 6x source tables is via the IRSA/GATOR catalog query service. GATOR defaults to searches of the full 2MASS 6x-PSWDB and 6x-XSWDB with the additional constraint of selecting only database entries with the highest probability of reliability (rel="A"). To limit searches to the subset of rows that constitute the 6x-PSC or 6x-XSC:
- Enter cat=1 in the "Additional Constraints (SQL)" dialog box at the bottom of the GATOR query page, and
- Change the "Reliability Limit" to "A-F(all)" by clicking that radio button in the "Reliability Limit" dialog box in the center of the query page.
The second step is necessary because the catalog
selection rules (for both All-Sky and 6x catalogs) are
different than the reliability scoring rules,
and result in the inclusion of a small fraction of sources that have
reliability scoring lower than "A" (see the discussions of 6x
point
and extended source
reliability).
The 6x observation data products are summarized in Table 1. These 6x products include Image Atlas and Working Databases (WDBs) from 1,328 long-exposure mode scans taken in photometric conditions. The 6x Point and Extended Source WDBs contain positions, magnitudes and characteristics of 24,023,702 and 247,091 point and extended "source" extractions, respectively, some of which are spurious detections of noise and image artifacts. The full 6x Atlas contains 69,687 FITS images in the three survey bandpasses covering ~80 deg2 of sky. The 6x-PSC and 6x-XSC are subsets of the 6x-PSWDB and 6x-XSWDB that contain astrometry and photometry of 8,637,594 and 84,041 sources, respectively, extracted from 1,031 unique 6x scans of the sky.
Users are strongly encouraged to read
the Cautionary Notes on the 2MASS 6x data products
before using the Working Databases, Catalogs or Image Atlas.
| 6x WDBs | 6x Catalogs | |
|---|---|---|
| Point Source Extractions | 24,023,702 | 8,637,594 |
| Extended Source Extractions | 247,091 | 84,041 |
| Atlas Images | 69,687 | 52,671 |
| Scans | 1,328 | 1,031 |
a. 6x Target Fields
Table 2 contains a list of the fields in which 2MASS 6x observations were made under photometric conditions. The table includes the name of the primary astronomical target in each field, the target type, approximate geometric center of the field, and the approximate area covered by the observations. The actual scan coverage of each field can be quite irregular, so the field centers and areas are for illustrative purposes only. Click on the target name in Table 2 to view a sky map showing the outlines of the 6x scans and distribution of point source WDB extractions for each field to best see the achieved coverage. Click on the "JPG" column to see a 1/4 scale 3-color composite 6x Atlas Image mosaic image of each field, where available.
2MASS 6x observations were conducted using the same declination freeze-frame-scanning technique used for the main survey (A3.4.a). Some of the fields were observed using 6° long scans, identical to those used for the main survey. Smaller 6x targets were observed using 1° long scans, akin to those used for the main survey's calibration field observations. The "Scan Length" column in Table 2 indicates which type of scan was used for each field. Not all fields were uniformly covered because of weather and/or scheduling constraints. In addition, a telescope commanding software error resulted in offsets in the starting declination of some 1° 6x scans. This led to coverage gaps in adjacent declination bands for some fields. The most fragmented coverage is found in the Chameleon II, Hydra Cluster, Abell 754 and Abell 3420 fields which were split into two sub-fields separated by up to ~4°. The declination gaps in the remaining fields are typically up to a few arcminutes in size (e.g. M31).
| Target1 | JPG2 | Type | RA (deg)3 | Dec (deg)3 | Scan Length | Area (deg2)4 |
|---|---|---|---|---|---|---|
| Test1 | n/a | -- | 10.4206 | -8.9968 | 6 | 0.9 |
| M31 | X | galaxy | 10.6591 | +41.1169 | 1 | 2.8 |
| SMC | n/a | galaxy | 14.1279 | -71.9268 | 6 | 127 |
| Test2 | n/a | -- | 14.1411 | -2.8711 | 6 | 0.9 |
| Pisces | X | galaxy cluster | 17.4281 | +32.4980 | 1 | 1.4 |
| Abell_262 | X | galaxy cluster | 28.3251 | +36.4976 | 1 | 1.3 |
| Test3 | n/a | -- | 28.9195 | -8.8695 | 6 | 0.9 |
| Abell_347 | X | galaxy cluster | 36.4889 | +41.4906 | 1 | 1.4 |
| Abell_401 | X | galaxy cluster | 45.4584 | +13.4487 | 1 | 0.1 |
| Abell_407 | X | galaxy cluster | 45.5000 | +35.5046 | 1 | 1.4 |
| Abell_426 | X | galaxy cluster | 50.0204 | +41.5000 | 1 | 1.4 |
| Perseus/NGC1333 | X | star formation | 52.3252 | +31.4948 | 1 | 1.4 |
| IC348 | X | star formation | 56.2526 | +32.4924 | 1 | 1.4 |
| Pleiades | X | open cluster | 56.7658 | +24.0072 | 1 | 5.3 |
| 3C129 | X | galaxy cluster | 72.2288 | +45.4899 | 1 | 1.4 |
| LMC | n/a | galaxy | 84.2185 | -68.9275 | 6 | 383 |
| Abell_553 | X | galaxy cluster | 93.2249 | +48.4880 | 1 | 1.4 |
| Cancer_Cluster | X | galaxy cluster | 125.2142 | +21.5038 | 1 | 1.4 |
| Test4 | n/a | -- | 126.4036 | -36.5243 | 6 | 0.9 |
| Test5 | n/a | -- | 127.1305 | -68.7999 | 6 | 0.9 |
| Abell_754 | N S | galaxy cluster | 137.2349 | -14.1352 | 1 | 1.4 |
| Abell_3420 | N S | galaxy cluster | 142.9724 | -29.3205 | 1 | 2.8 |
| Hydra_Cluster | N S | galaxy cluster | 159.2946 | -29.5395 | 1 | 6.9 |
| Lockman_hole | n/a | high latitude | 161.1353 | +56.8362 | 6 | 28.3 |
| ChamII | N | star formation | 196.1528 | -77.1925 | 1 | 2.8 |
| Abell_3558 | X | galaxy cluster | 202.0661 | -33.0073 | 6 | 4.6 |
| Lupus | X | star formation | 241.9122 | -38.6927 | 1 | 2.2 |
| Ophiuchus | X | star formation | 246.6450 | -24.4195 | 1 | 1.0 |
| Cygnus | X | star formation | 297.9436 | +50.4908 | 1 | 1.4 |
| IC1396 | X | star formation | 324.7757 | +57.4289 | 1 | 1.4 |
Notes to Table 2
- Intended target of long exposure observations. Some targets may not have been fully covered. Click on the target name to view the sky map showing the 6x scan coverage and location of all 6x PSWDB extractions (LMC and SMC maps show scan outlines only).
- Click on this column to view a 3-color composite JPEG 6x Atlas Image mosaic of the field, where available. Separate images, marked "N" and "S", are available for the fields with split coverage (except ChamII which has only "N" mosaic available). Mosaic images are not available for all fields. Image mosaics generated by A. Laity using the MONTAGE image mosaic software.
- Approximate field centers in J2000 equatorial coordinates. These may not be representative for fields with irregular or split coverage. See the sky coverage maps.
- Approximate area covered by 6x scans in each field. Coverage may be highly irregular.
b. Relationship to Main 2MASS Survey
The objective of the 2MASS 6x observations was to produce well-characterized image and extracted source data sets that probe one magnitude deeper than the main 2MASS survey. The increase in sensitivity will enable study of intrinsically less luminous and more distant source populations in a variety of environments.
A comparison of the point and extended source counts derived from the 6x and All-Sky PSC and XSC in the same area of the Pleiades field is shown in Figure 1. In this field, the sensitivity increase achieved relative to the survey is greater than 1 magnitude because the seeing, background and atmospheric transparency conditions were better during the 6x observations than during the survey scans of the region. At the distance and age of the Pleiades, the bottom of the main sequence has an apparent magnitude of Ks~14.3 (Chabrier et al. 2000, ApJ, 542, 464), equal to the nominal completeness level of the 2MASS All-Sky PSC. This is confirmed by actual searches of the PSC at the positions of known Pleiades members (e.g. Adams et al. 2001, AJ, 121, 2053). The 2MASS 6x observations reach a limiting absolute magnitude of at least MKs~9.8 in the Pleiades, corresponding to 0.05 Msun - well into the substellar regime. Figure 2 compares the color-magnitude diagram for all 6x-PSC sources in the Pleiades field with that from the All-Sky PSC in the same region. The expected Ks magnitude for the hydrogen burning limit in the cluster is marked by the red line, and confirmed cluster members are denoted in green (Stauffer et al. 1984, ApJ, 280, 189; and private communication).
 |
 |
| Figure 1 - Comparison of 6x and All-Sky PSC and XSC differential source counts in 3.65 deg2 of the Pleiades field. Counts are scaled by area. | Figure 2 - Click on this image to view a blink comparison between the color-magnitude diagrams from the 2MASS 6x-PSC and All-Sky PSC for objects in the Pleiades field. Confirmed cluster members are shown in green (J. Stauffer private comm.). The horizontal red line denotes the brightness of an M6.5 dwarf in the Pleiades at the hydrogen burning limit. |
Near-infrared galaxy source counts double for each 0.5 magnitude of increased depth. Therefore, the 6x measurements of high latitude fields quadruple the number of galaxies detected by 2MASS in a given area, significantly improving statistics of field luminosity functions and variation across the sky, for example. The 6x and All-Sky XSC and PSC normalized source counts in the Lockman Hole field are compared in Figure 3. The increase in total galaxy detections is evident in the extended source counts. In addition, extrapolating the galaxy counts to fainter magnitudes shows that the Ks>15.5 mag point source counts begin to be dominated by unresolved galaxies. This accounts, in part, for the upturn in the point source counts in the faintest 6x bins. Some of the upturn is also caused by statistical flux overestimation in the low SNR detections (as is seen in the faintest All-Sky PSC magnitude bins). Beichman et al. (2003 AJ, 125,2521) analyzed the point source extractions from a preliminary version of the 2MASS 6x Lockman Hole data and discussed searches for candidate brown dwarfs and obscured AGN that are representive of the potential findings in the 2MASS 6x field data.
The improved sensitivity of the 6x Lockman Hole measurements relative to the main 2MASS survey makes them better matched to the depth of Spitzer Space Telescope SWIRE Legacy program observations. Measurements from the 6x-PSC have been used to help distinguish extragalactic source types and determine photometric redshifts (M. Polletta private communication). This is illustrated in Figure 4 which shows a color-color diagram that combines optical g-band, 2MASS 6x Ks-band and Spitzer/IRAC 3.6 and 4.5 μm band photometry. The tracks in the diagram illustrate how the colors of different classes of objects (e.g. ellipticals, spirals, starbursts, AGN, etc) are expected to vary with redshift. The points show the measurements of SWIRE/2MASS detected sources, with color denoting the photometric redshift range. Also shown in Figure 4 are examples of optical, 2MASS and Spitzer/IRAC photometric points fit to source templates for the purpose of source classification and photometric redshift determination. The near infrared photometry from the 2MASS 6x-PSC combined with optical photometry provides a sensitive constraint on redshift for normal galaxies.
2MASS long exposure measurements in crowded fields do not realize as large an increase in sensitivity because of confusion noise. For example, the area-normalized 6x-PSC and All-Sky PSC counts in the Lupus 6x field are compared in Figure 5. The integrated Ks source surface density in this region is nearly 30 times higher than in the Lockman Hole field. The effective improvement in sensitivity relative to the main survey is ~0.5 mag less than in the Lockman Hole. There are very few galaxies detected in this field because of foreground extinction and because of confusion with Galactic stars.
 |
 |
 |
| Figure 3 - Comparison of 6x and All-Sky PSC and XSC differential source counts in the 6x Lockman Hole field. Counts are and scaled by area. | Figure 4 - Color-color diagram combining g-band, 2MASS 6x Ks- band, and Spitzer/IRAC 3.6 and 4.5 μm band data for sources detected in the Lockman Hole region. The surrounding plots show multi-band photometry fit to various galaxy templates to determine source type and photometric redshift (courtesy of M. Polletta). | Figure 5 - Comparison of 6x and All-Sky PSC and XSC differential source counts in a 0.64 deg2 region of the 6x Lupus field. |
c. Additional 6x Data Products
The 6x Merged Point and Extended Source Information and
Cross-Reference Tables contain the
average brightnesses and positions of reliable sources detected
multiple times in the 6x scan observations. Included in the
Merged Source Information tables are various statistics
designed to help identify candidate variable, transient or moving objects,
or merge cases that may be affected by confusion.
The Cross-Reference tables provide rapid access to all sightings of the
same object in the 6x Point and Extended Source WDB. The WDB merging
process and resulting products are described in
Appendix 6.
d. Cautionary Notes
i. General
ii. 6x Point Source Working Database
and Catalog
iii. 6x Extended Source Working Database and Catalog
iv. 6x Image Atlas
[Last Updated: 2008 February 12; by R. Cutri]
Previous page. Next page.
Return to Explanatory Supplement TOC Page.