I. Very Bright Star Photometry
Preliminary 2MASS data processing included a rudimentary effort to estimate the brightness of stars that saturated the 0.51 ms 2MASS Read_1 exposures by photometering the first persistence artifacts from those objects. This proved to be ineffectual and for the incremental data releases "filler" or "placeholder" entries were included in the Point Source Catalog to indicate the presence of bright stars, but no brightness information was provided.
One of the key upgrades included in 2MAPPS v3.0 is an algorithm to estimate the brightness of saturated Read_1 stars by fitting the non-saturated wings of azimuthally-average radial profiles of these objects to a template. The algorithm and template development and calibration are described in a series of memos by Gene Kopan, Raymond Tam and Cong Xu.
The goal for photometric accuracy of the very bright stars is < 0.3 mag per band.
II. Bright Star Colors
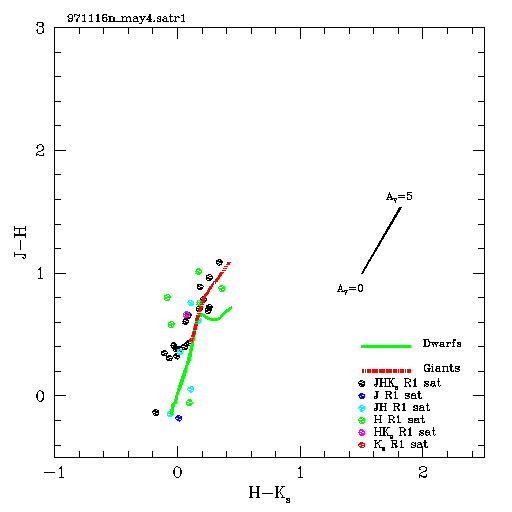
The saturated star photometry has been implemented in FREXAS for 2MAPPS v3.0 and is running on the regression test baseline night set. One performance diagnostic of the new algorithm is the colors of the very bright stars relative to those expected for normal stars. The plots below show a series of color-color and color-magnitude diagrams for each processed version of the RTB nights. I suggest that these plots may be useful nightly diagnostics to be included in 2MAPPS v3.0 QA.
Caveat - In the runs before April 26, the identification procedure for saturated R1 stars incorrectly marked a small number of non-saturated stars as saturated and saturated stars as non-saturated. Runs after April 26 should not have this problem.
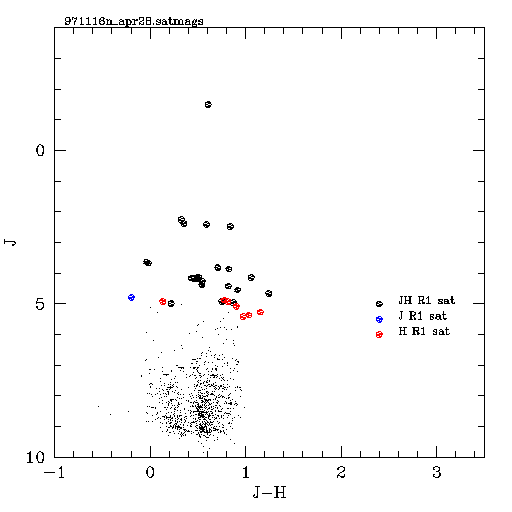
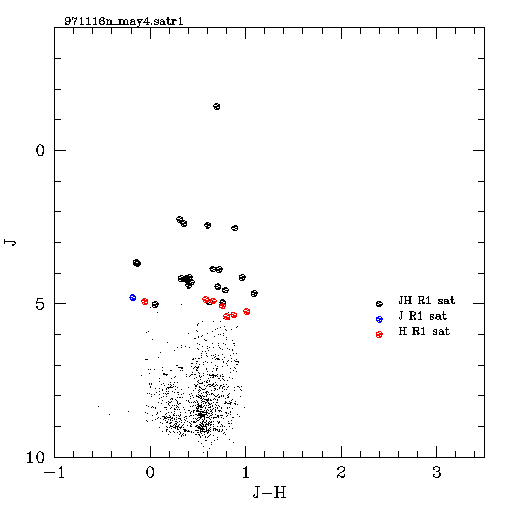
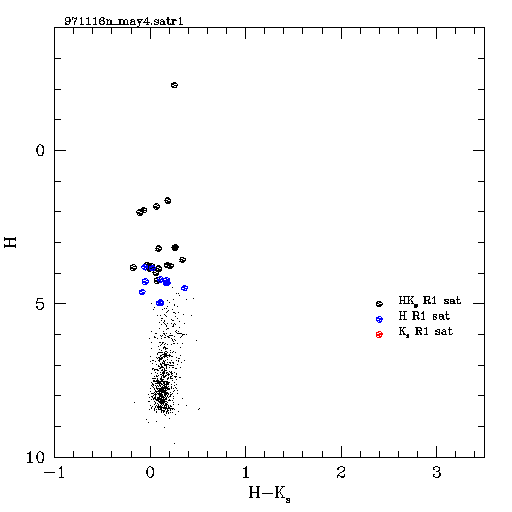
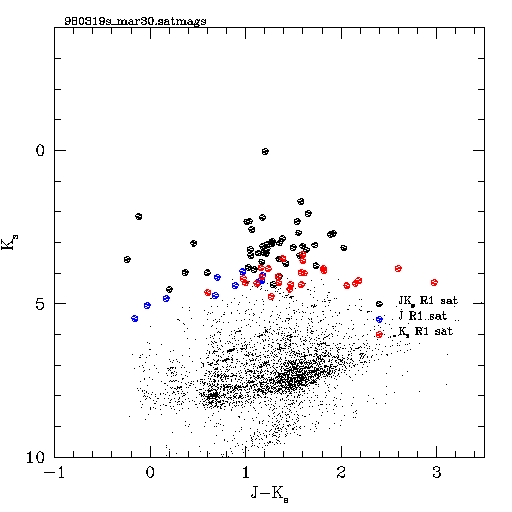
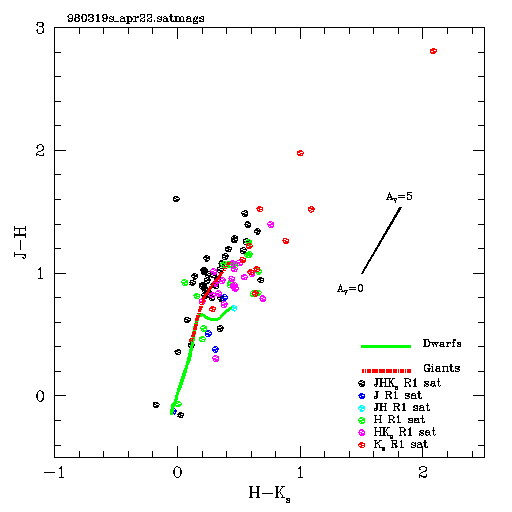
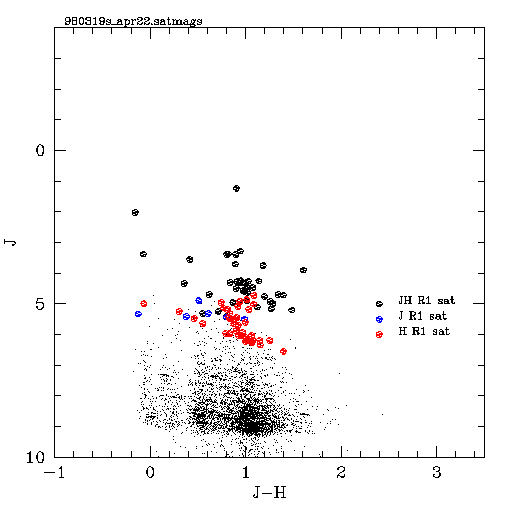
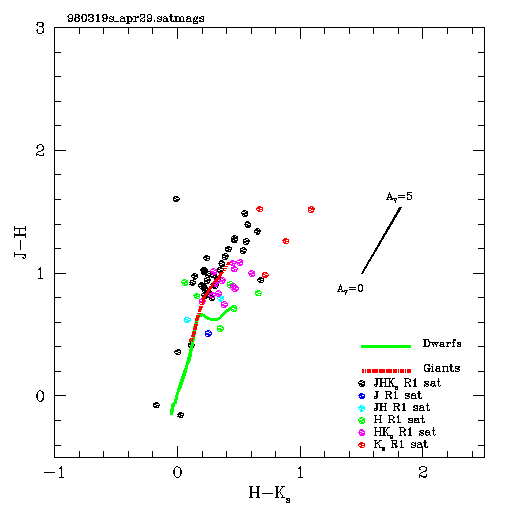
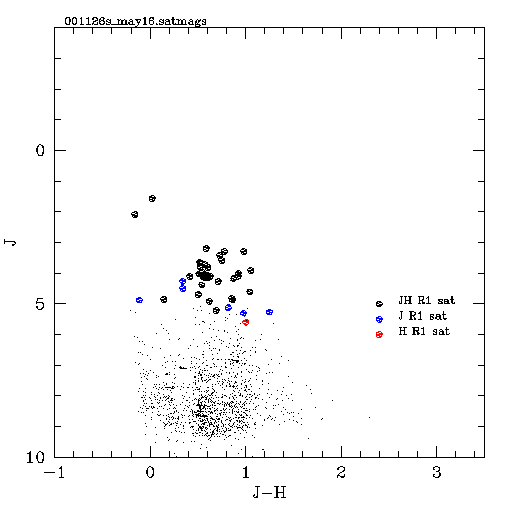
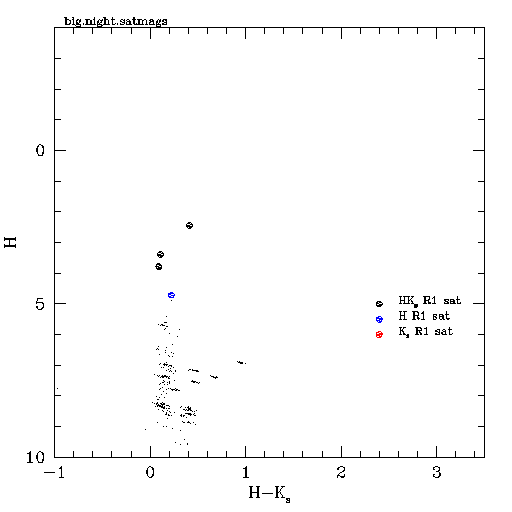
Table 1 - Color-color plots and CMD's for RTB nights
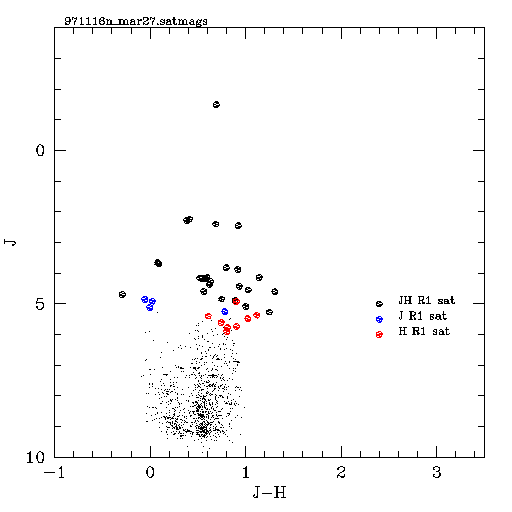
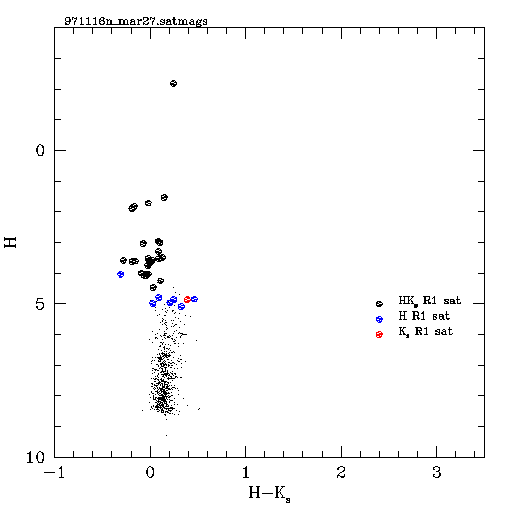
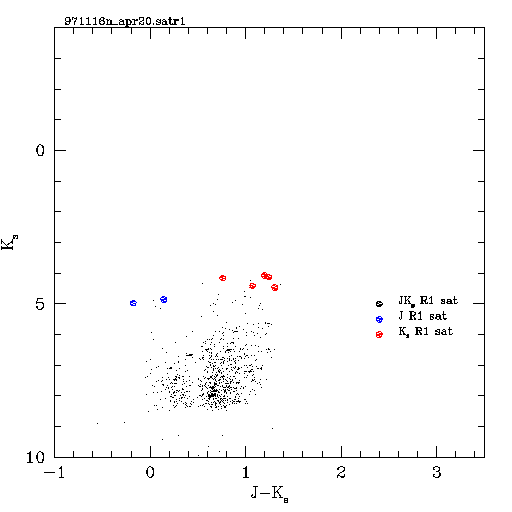
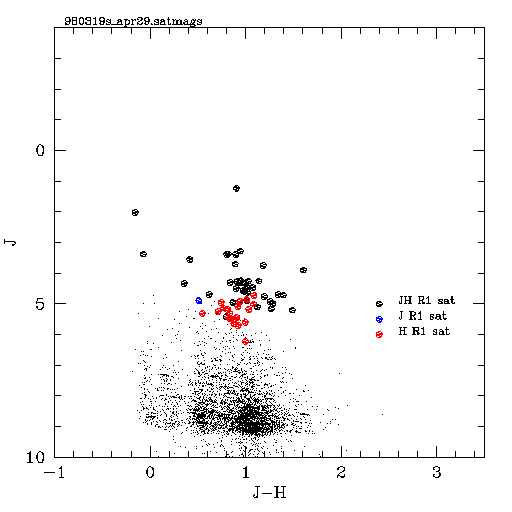
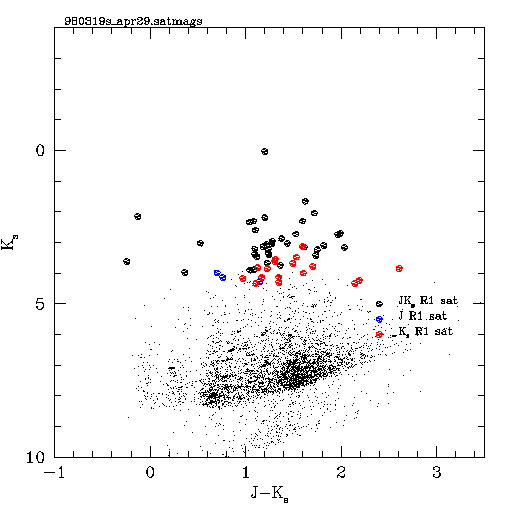
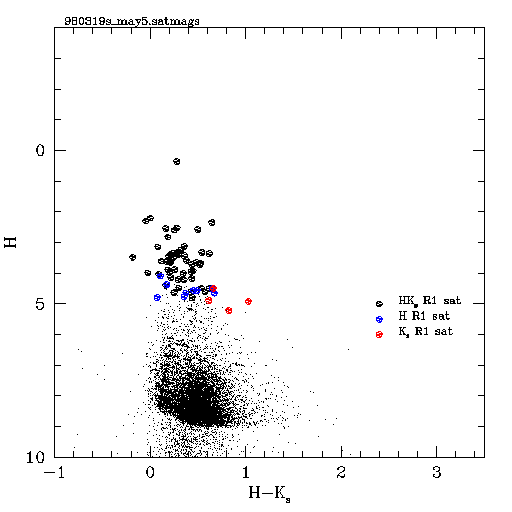
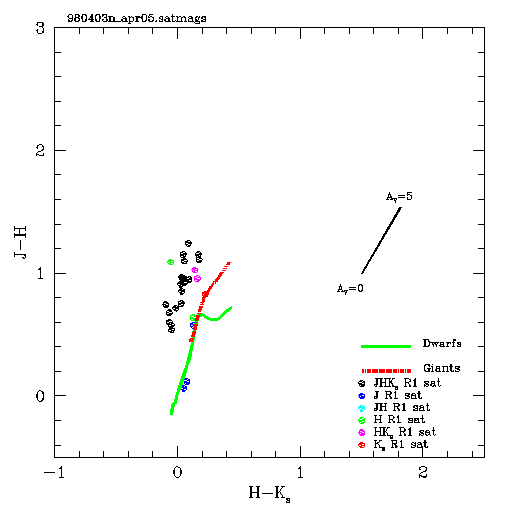
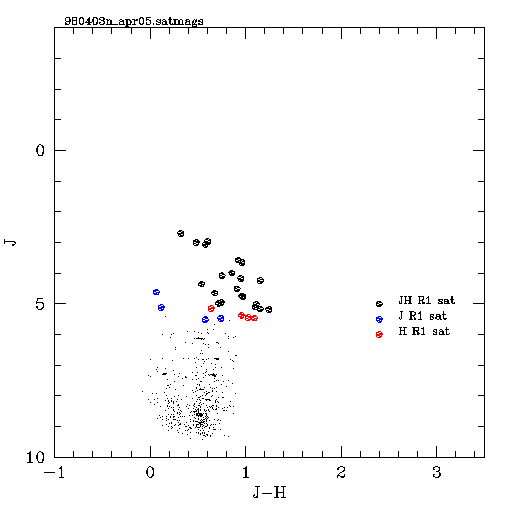
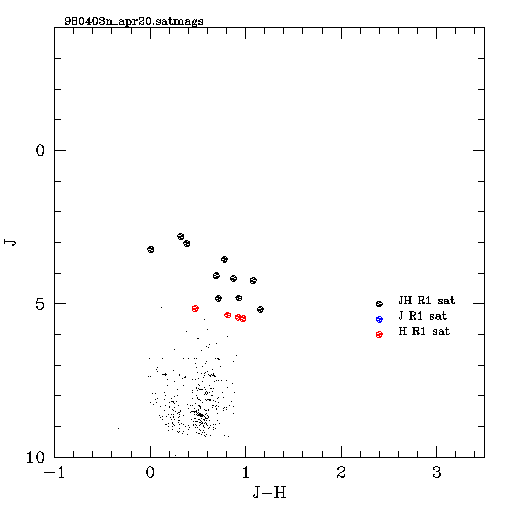
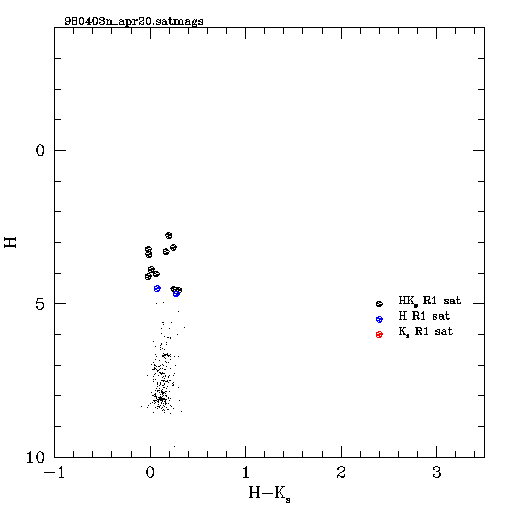
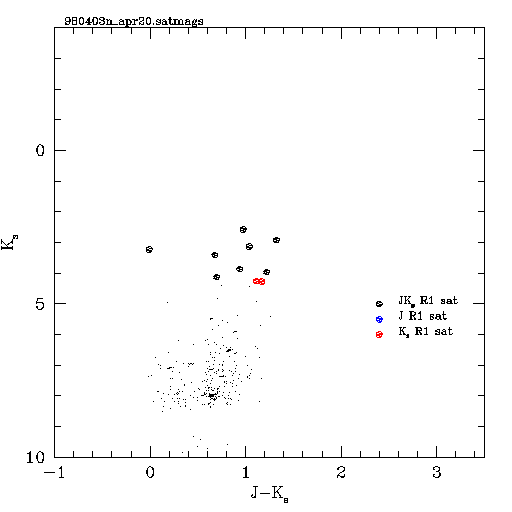
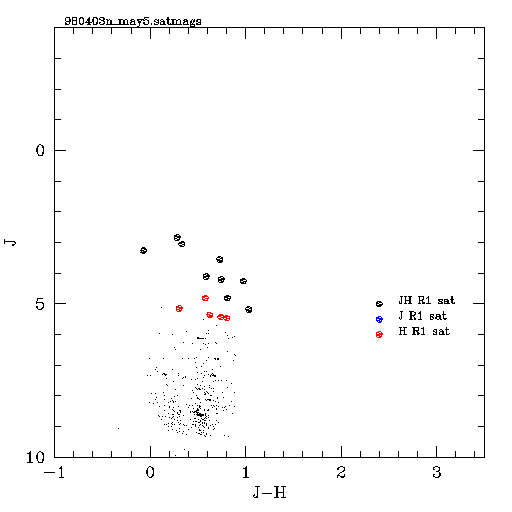
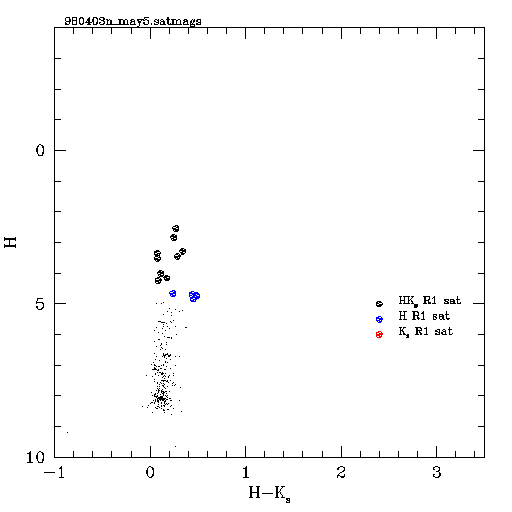
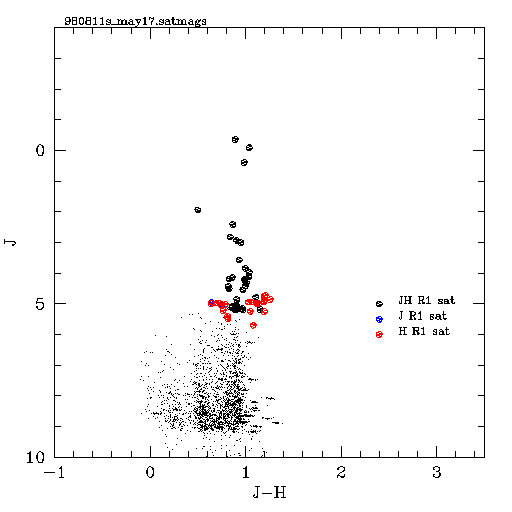
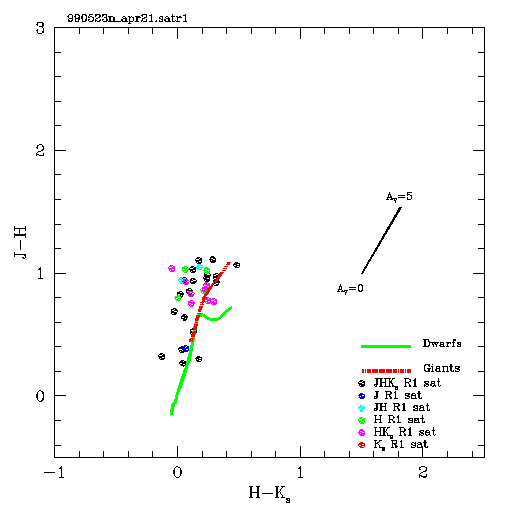
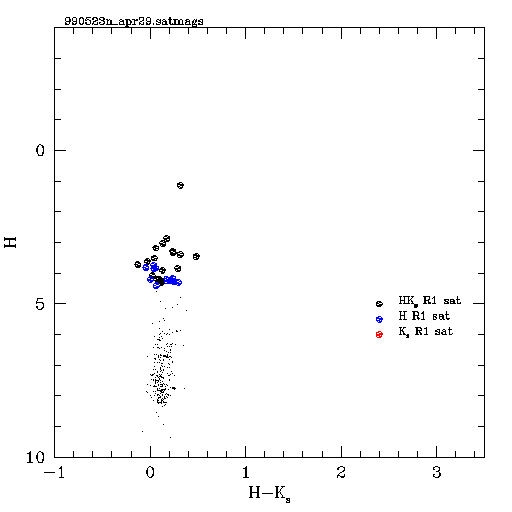
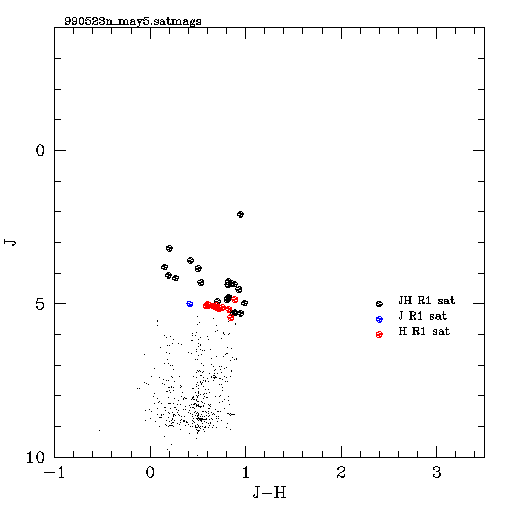
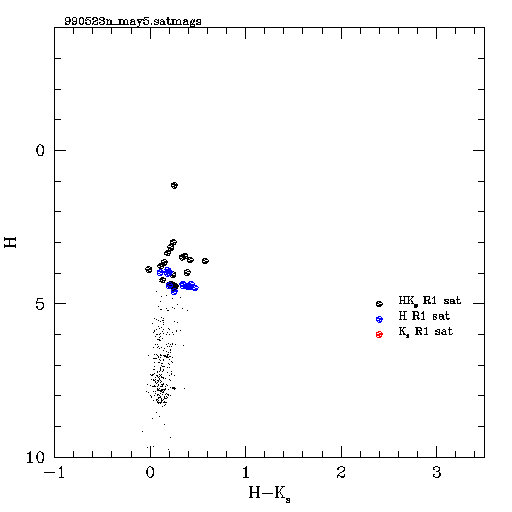
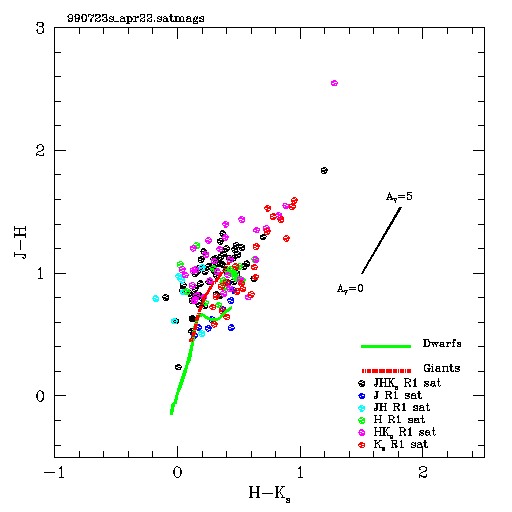
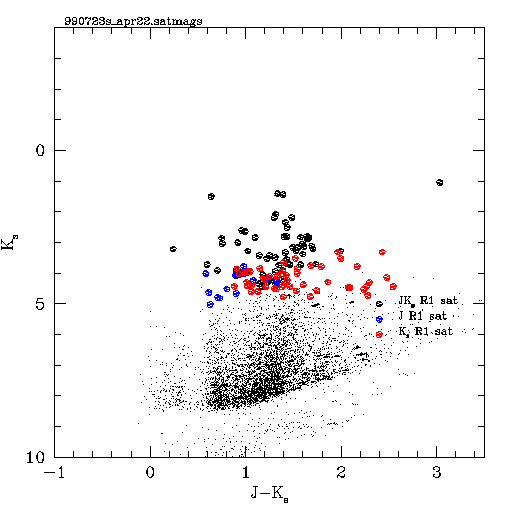
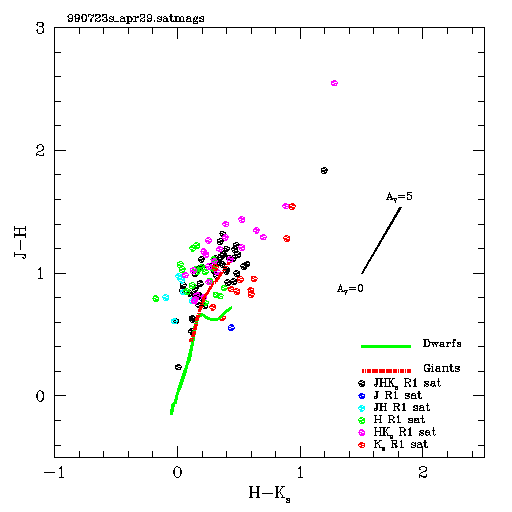
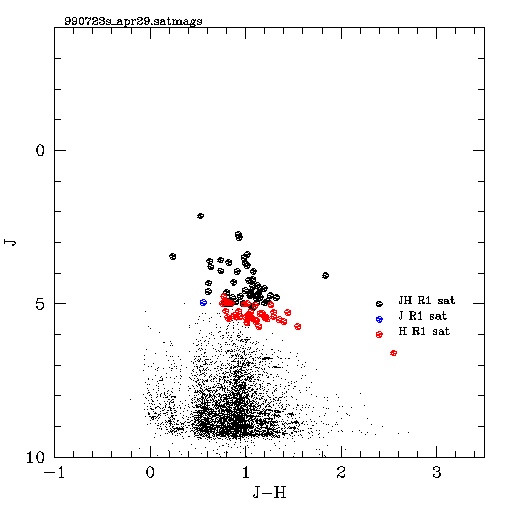
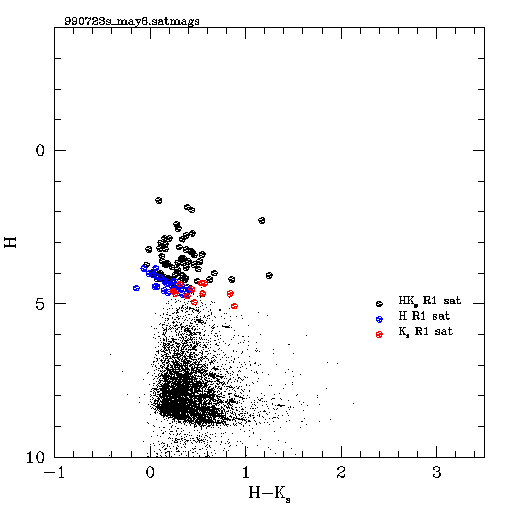
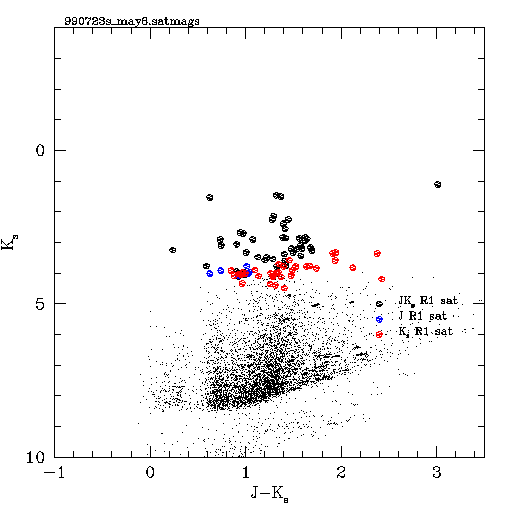
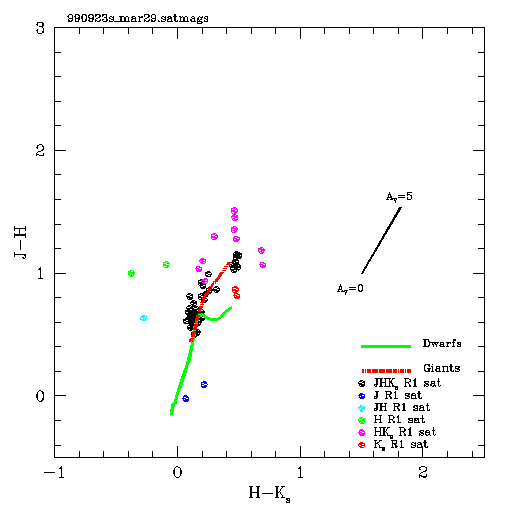
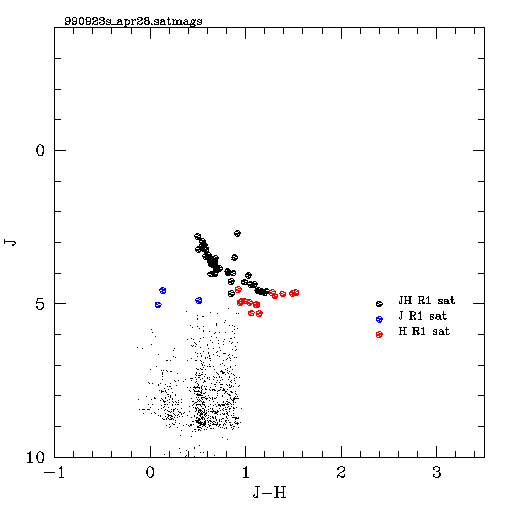
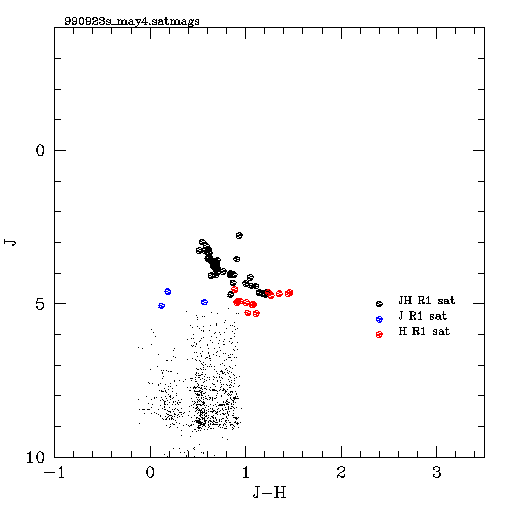
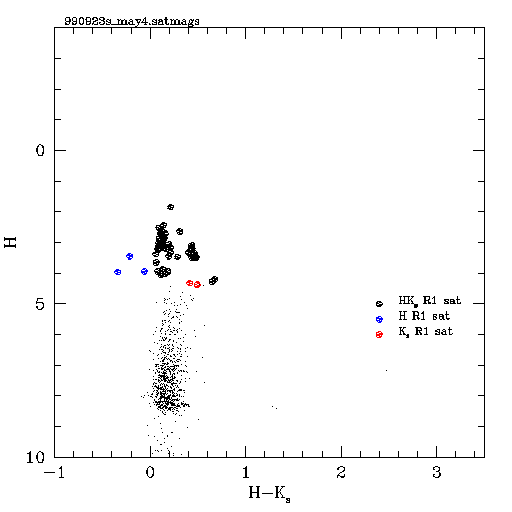
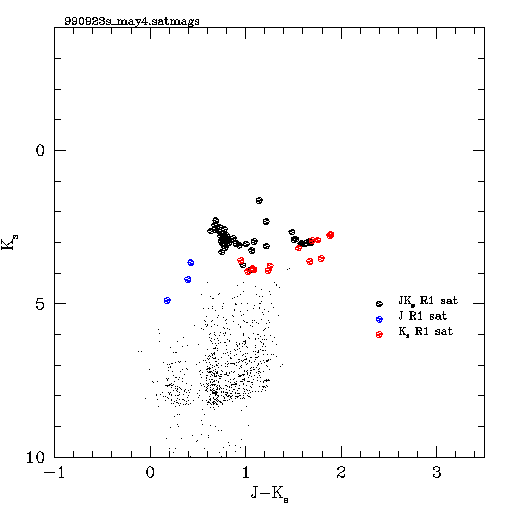
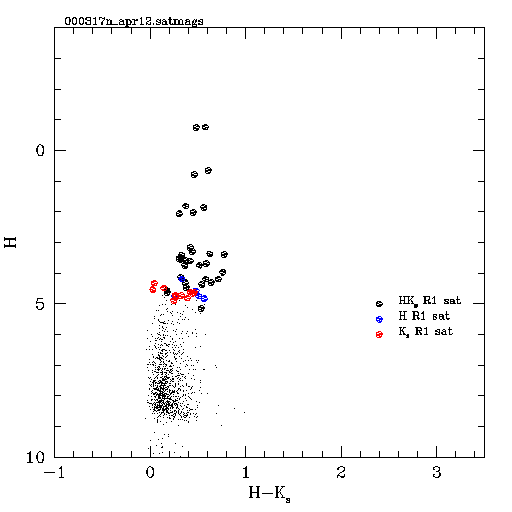
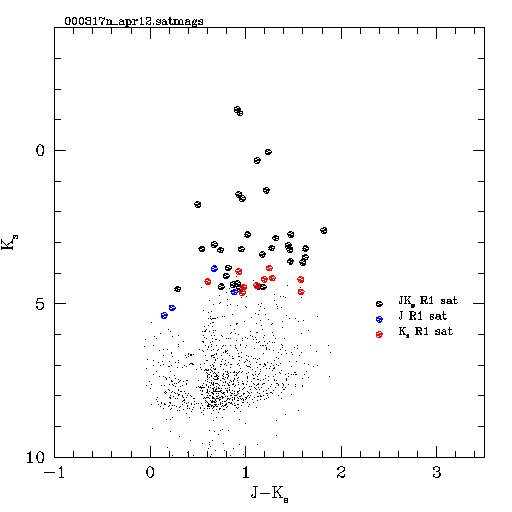
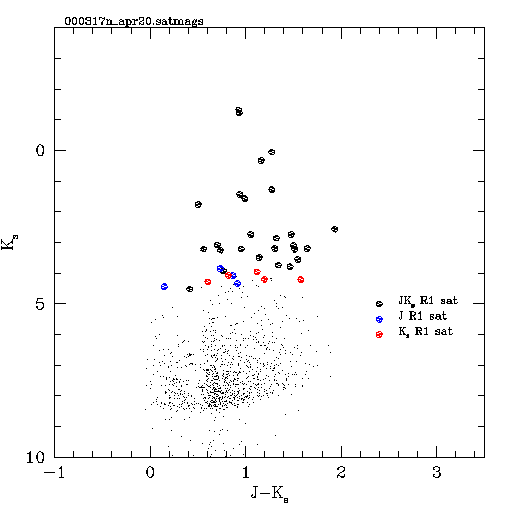
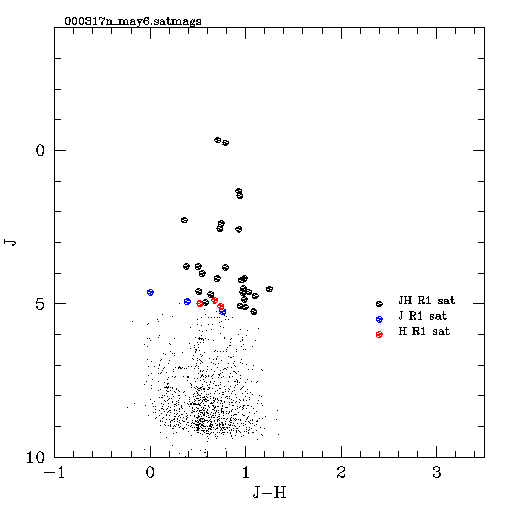
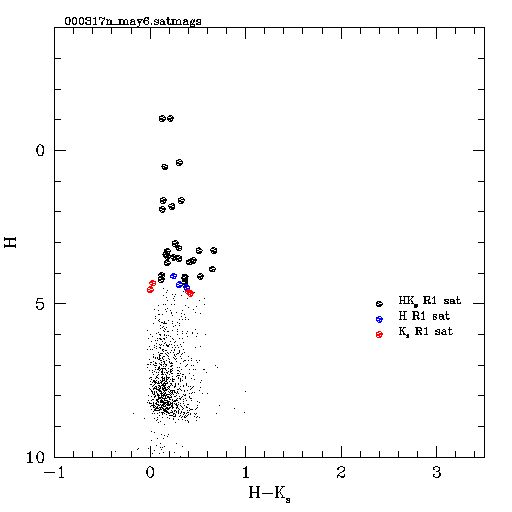
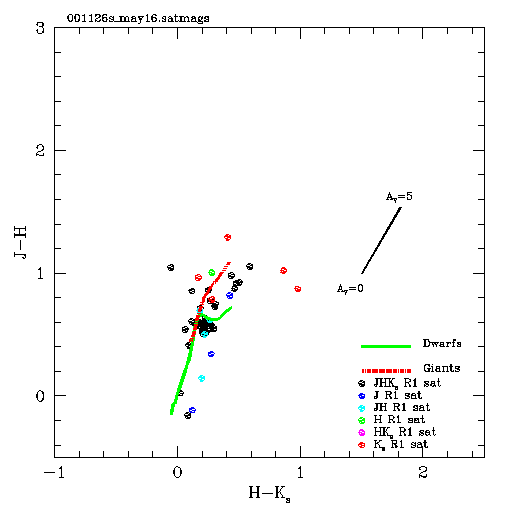
A brief description of the plots listed in Table 1 follows:
- The J-H vs. H-Ks color-color plots for all sources
in each night that are saturated in Read_1 in at least one band.
Color coding of the points indicates in which bands the source is
saturated:
- black - saturated in all three bands
- blue - saturated in J only
- cyan - saturated in J and H
- green - saturated in H only
- magenta - saturated in H and Ks
- red - saturated in Ks only
- The J vs. J-H color-magnitude diagram. Color coding of the points
indicates in which bands the source is saturated:
- black - saturated in J and H
- blue - saturated in J only
- red - saturated in H only
- The H vs. H-Ks color-magnitude diagram. Color coding of the
points indicates in which bands the source is saturated:
- black - saturated in H and Ks
- blue - saturated in H only
- red - saturated in Ks only
- The Ks vs. J-Ks color-magnitude diagram.
Color coding of the points indicates in which bands the source is
saturated:
- black - saturated in J and Ks
- blue - saturated in J only
- red - saturated in Ks only
III. Single-Frame Unsaturated Read 1 Sources
The standard procedure for deriving photometry for bright sources has been to quote the R1 magnitude if a source is unsaturated in two or more frames. If a source is unsaturated in only a single frame, then the pipeline currently passes the single frame R1 aperture magnitude, but encodes it with a magnitude uncertainty of 9.997. In doing the R1/R2 merging, MAPCOR does not pass along the single-frame aperture magnitude, but treats the source as saturated.
For final processing, we need to decide whether to use the single-frame unsaturated R1 aperture photometry for such sources, or the saturated star photometric template fitting from the <5 saturated frames. There are advantages and disadvantages to both.
Single-Frame Aperture Photometry
- Advantages
- Such sources will high a relatively high signal-to-noise ratio on the unsaturated frame, so aperture photometry normally provides an excellent measure of the brightness.
- Disadvantages
- Measurements taken from a single frame have a greater possibility of being biased by a cosmic ray hit on the source, or some contamination in the background estimate.
- The DAOPHOT-style algorithm used for 2MASS aperture photometry invariably underestimates the uncertainty because it includes only Poisson noise. The 2MAPPS measurement uncertainty returned for "normal" aperture photometry where there are multiple unsaturated frames is the standard deviation of the aperture photometry brightness on the individual frames. Some other means of estimating photometry uncertainty would need to be used for single-frame aperture magnitudes.
Saturated-Star Template Photometry
- Advantages
- Based on fits on multiple frames
- Disadvantages
- The saturated-star template fitting has the poorest accuracy near the R1 saturation limit because only a small, relatively low SNR portion of the star's radial profile is available for the fit.
1. Expected Precision of Single-Unsaturated-Frame Read 1 Photometry
The relative precision of aperture photometry from a single unsaturated R1 frame can be estimated from the observed dispersion of the normal aperture photometry from multiple unsaturated frames. Gene Kopan has compiled statistics on the repeatability of the single frame photometry, and his report follows:
I have checked the photometric repeatability for the single frame
r1 aperture photometry by computing the dispersion for sources found in
multiple frames for some scans from a northern and southern rtb night. The
results show ~0.045 scatter for the north in all 3 bands, a little higher in
the south, but H band in the south ran almost 0.10 mag in the scan I checked,
so I need to check more nights/scans in the south.

...I did a couple more nights/scans in the south, and they also show the H band
r1 single frame repeatablility to be worse in the south than in the
other bands and the north...

gene
---------------
	V3 r1 single frame (*_1.fex) photometric repeatability:

971116n dino:/b2/V3test       Apr 20 2001   no     no   online   82    ver3
971116n/s102-109:

    band     n      sigma mag
      j    1120      0.0449
      h    1447      0.0454
      k    1659      0.0448

980319s barney:/b1/V3test     Apr 21 2001   no     no   online   70    ver3
980319s/s039:

    band     n      sigma mag
      j    1532      0.0553
      h    1447      0.0964
      k    1659      0.0595

990923s wilma:/b1/V3test      Apr 28 2001   no     no   online   72    ver3
990923s/s013-019

    band     n      sigma mag
      j    1066      0.0471
      h    1807      0.0652
      k    1905      0.0578

/990723s/s025:

    band     n      sigma mag
      j    1735      0.0443
      h    4859      0.0834
      k    7685      0.0528
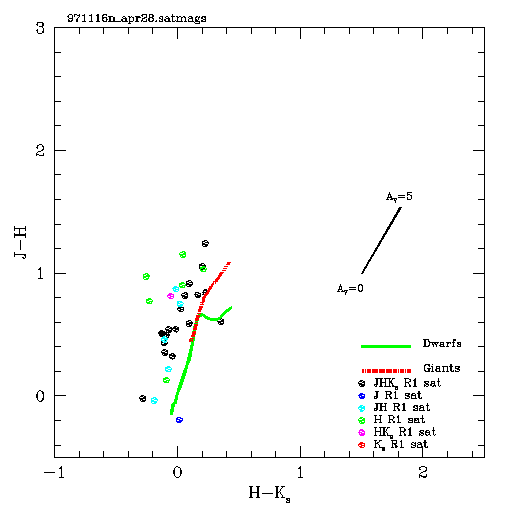
2. Observed Colors of Single-Unsaturated-Frame Read 1 Photometry
Figure 8 shows the JHKs color-color diagram for R1 sources in the 6 RTB nights. The small black points are sources with unsaturated R1 mags in all 3 bands. The larger color points show sources that have single-frame unsaturated R1 mags in one or more bands, as specified in the legend. For these points, the magnitudes in the other bands must be unsaturated R1 or R2, so there is no possible bias introduced by saturated R1 photometry.
 |
| Figure 8 |
There is an apparent bias in the single-unsaturated frame R1 photometry relative to multi-frame unsaturated R1 photometry. We now believe that this arises because single-unsaturated frame R1 star apparitions fall preferentially on edge or corner pixel boundaries where the light is distributed over 2 or 4 pixels. In addition, some light will be lost in the pixel gaps making these apparitions systematically fainter than those centered on pixels. This could account for the observed biases in the J- and H-only single-unsaturated frame colors, but not the Ks-only colors.
This is substantiated by the Intra-Pixel Response Variation analysis performed by Gene Kopan. Sources falling on the edges of edges of pixels can be systemmatically fainter by up to 0.1-0.2 mags than those falling on the centers of pixels. The magnitude of this effect is different for the 7 arrays used in the survey, being most pronounced for the southern H array and the new northern H-band array. The effect is most evident when the seeing is good, as poor seeing smooths the PSF over a larger area.
Figure 9 blinks between the color-color diagrams of single-unsaturated R1 frame sources from the northern and southern RTB nights. The unsaturated R1 points are not shown in this plot. The southern data has systematically better image quality, so if the bias seen in the single-frame photometry is related to the intrapixel losses, then the skew should be more pronounced in the southern data. Unfortunately, the number of single-frame R1 stars in the northern RTB nights is too small to draw any definitive conclusions.
 |
| Figure 9 |
Last Update - 18 May 2001
R. Cutri - IPAC